Yuran Zhu1, Yuning Gu1, Kihwan Kim1, Charlie Androjna2, Chris A. Flask1,3,4,5, Yong Chen3,6, and Xin Yu1,3,7
1Department of Biomedical Engineering, Case Western Reserve University, Cleveland, OH, United States, 2Lerner Research Institute, Cleveland Clinic Foundation, Cleveland, OH, United States, 3Department of Radiology, Case Western Reserve University, Cleveland, OH, United States, 4Department of Pediatrics, Case Western Reserve University, Cleveland, OH, United States, 5Cancer Imaging Program, Case Western Reserve University, Cleveland, OH, United States, 6Biomedical Research Imaging Center (BRIC), University of North Carolina at Chapel Hill, Chapel Hill, NC, United States, 7Department of Physiology and Biophysics, Case Western Reserve University, Cleveland, OH, United States
1Department of Biomedical Engineering, Case Western Reserve University, Cleveland, OH, United States, 2Lerner Research Institute, Cleveland Clinic Foundation, Cleveland, OH, United States, 3Department of Radiology, Case Western Reserve University, Cleveland, OH, United States, 4Department of Pediatrics, Case Western Reserve University, Cleveland, OH, United States, 5Cancer Imaging Program, Case Western Reserve University, Cleveland, OH, United States, 6Biomedical Research Imaging Center (BRIC), University of North Carolina at Chapel Hill, Chapel Hill, NC, United States, 7Department of Physiology and Biophysics, Case Western Reserve University, Cleveland, OH, United States
A 3D MRF sequence was developed for simultaneous T1 and T2
mapping of the entire mouse brain. Our results demonstrate that up to 16-fold in-plane and 3-fold through-plane
undersampling can be achieved with adequate accuracy, allowing whole-brain T1 and T2 mapping in 3 to 5 minutes.
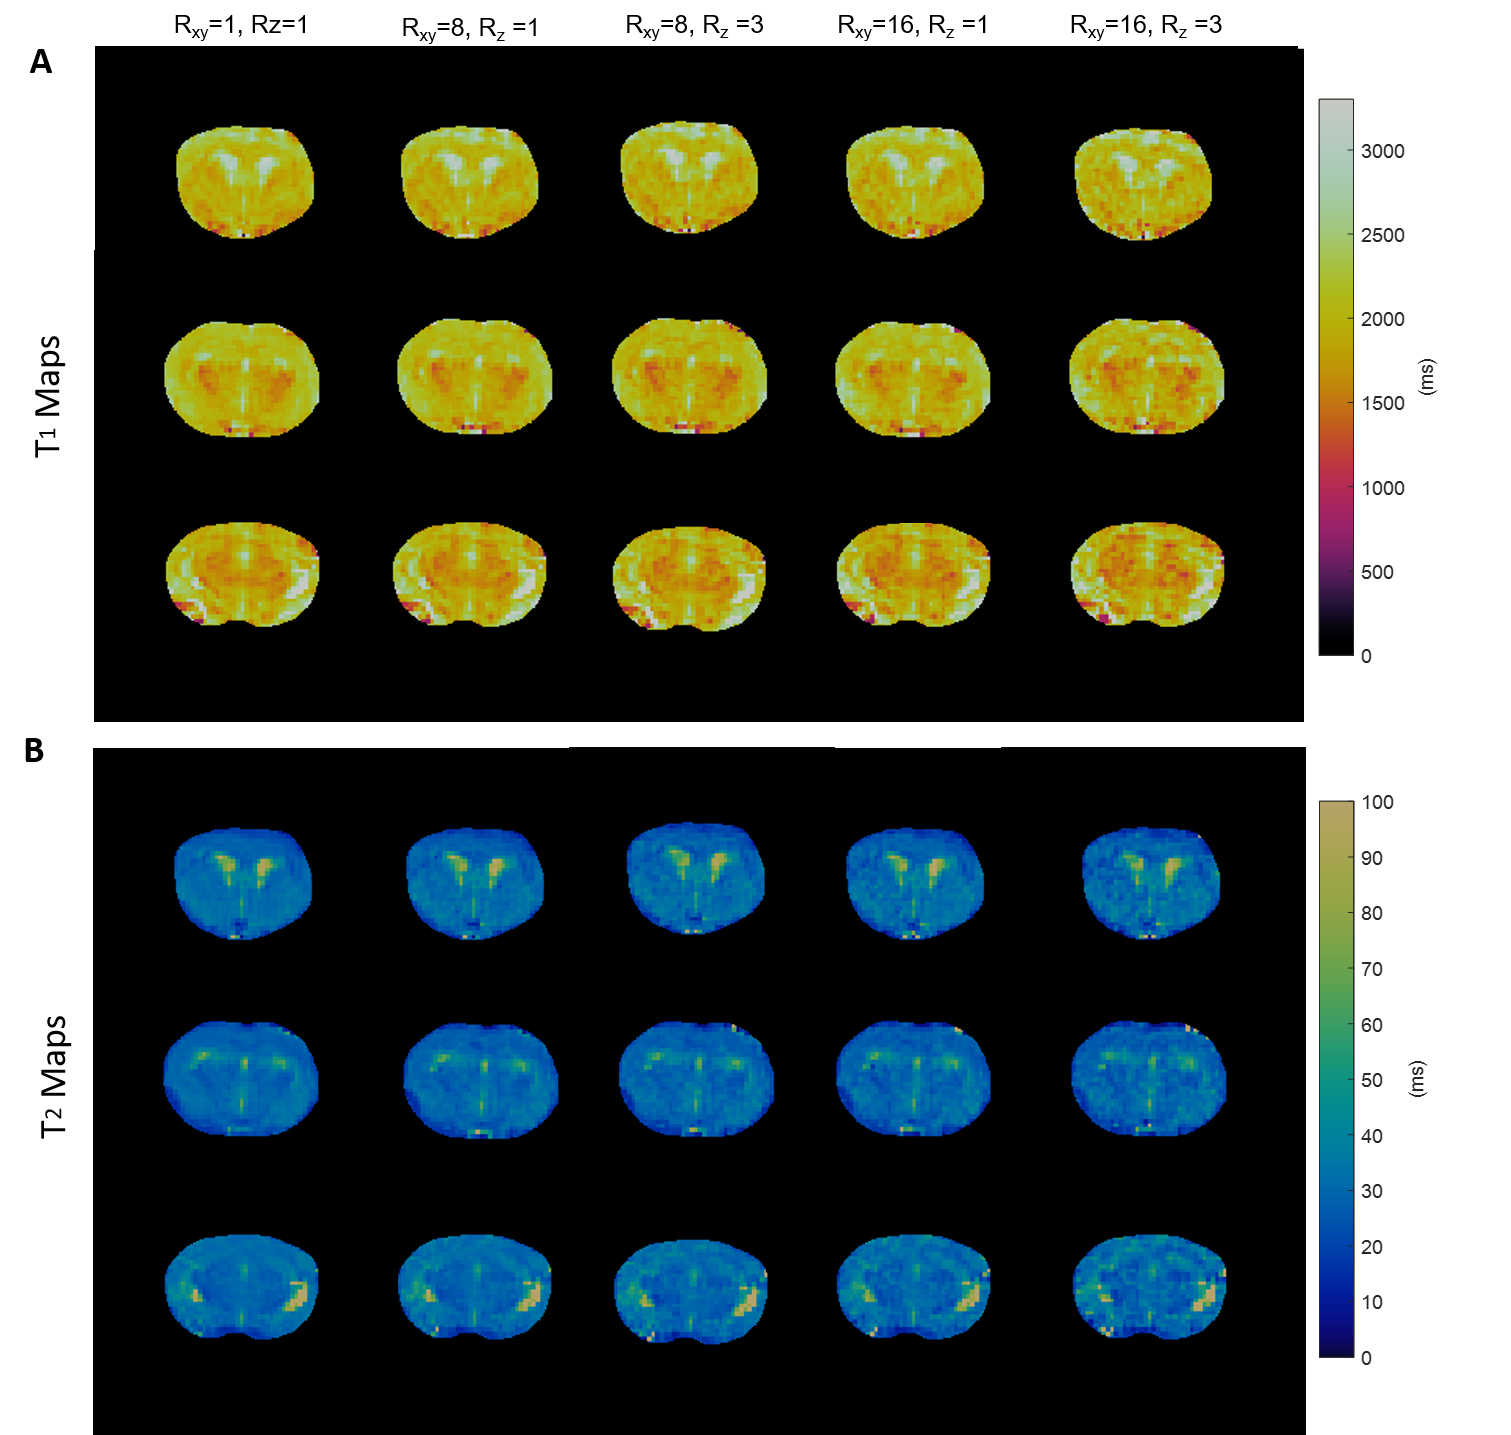
Figure
2. Retrospective
undersampling analysis on a fully-sampled mouse brain. A.
T1 maps of fully sampled (Rxy=1, Rz=1) mouse
brain and prospectively undersampled data (Rxy=8, Rz=1; Rxy=8,
Rz=3; Rxy=16, Rz=1; Rxy=16, Rz=3)
of three central axial views. B. T2
maps of fully sampled and undersampled results.
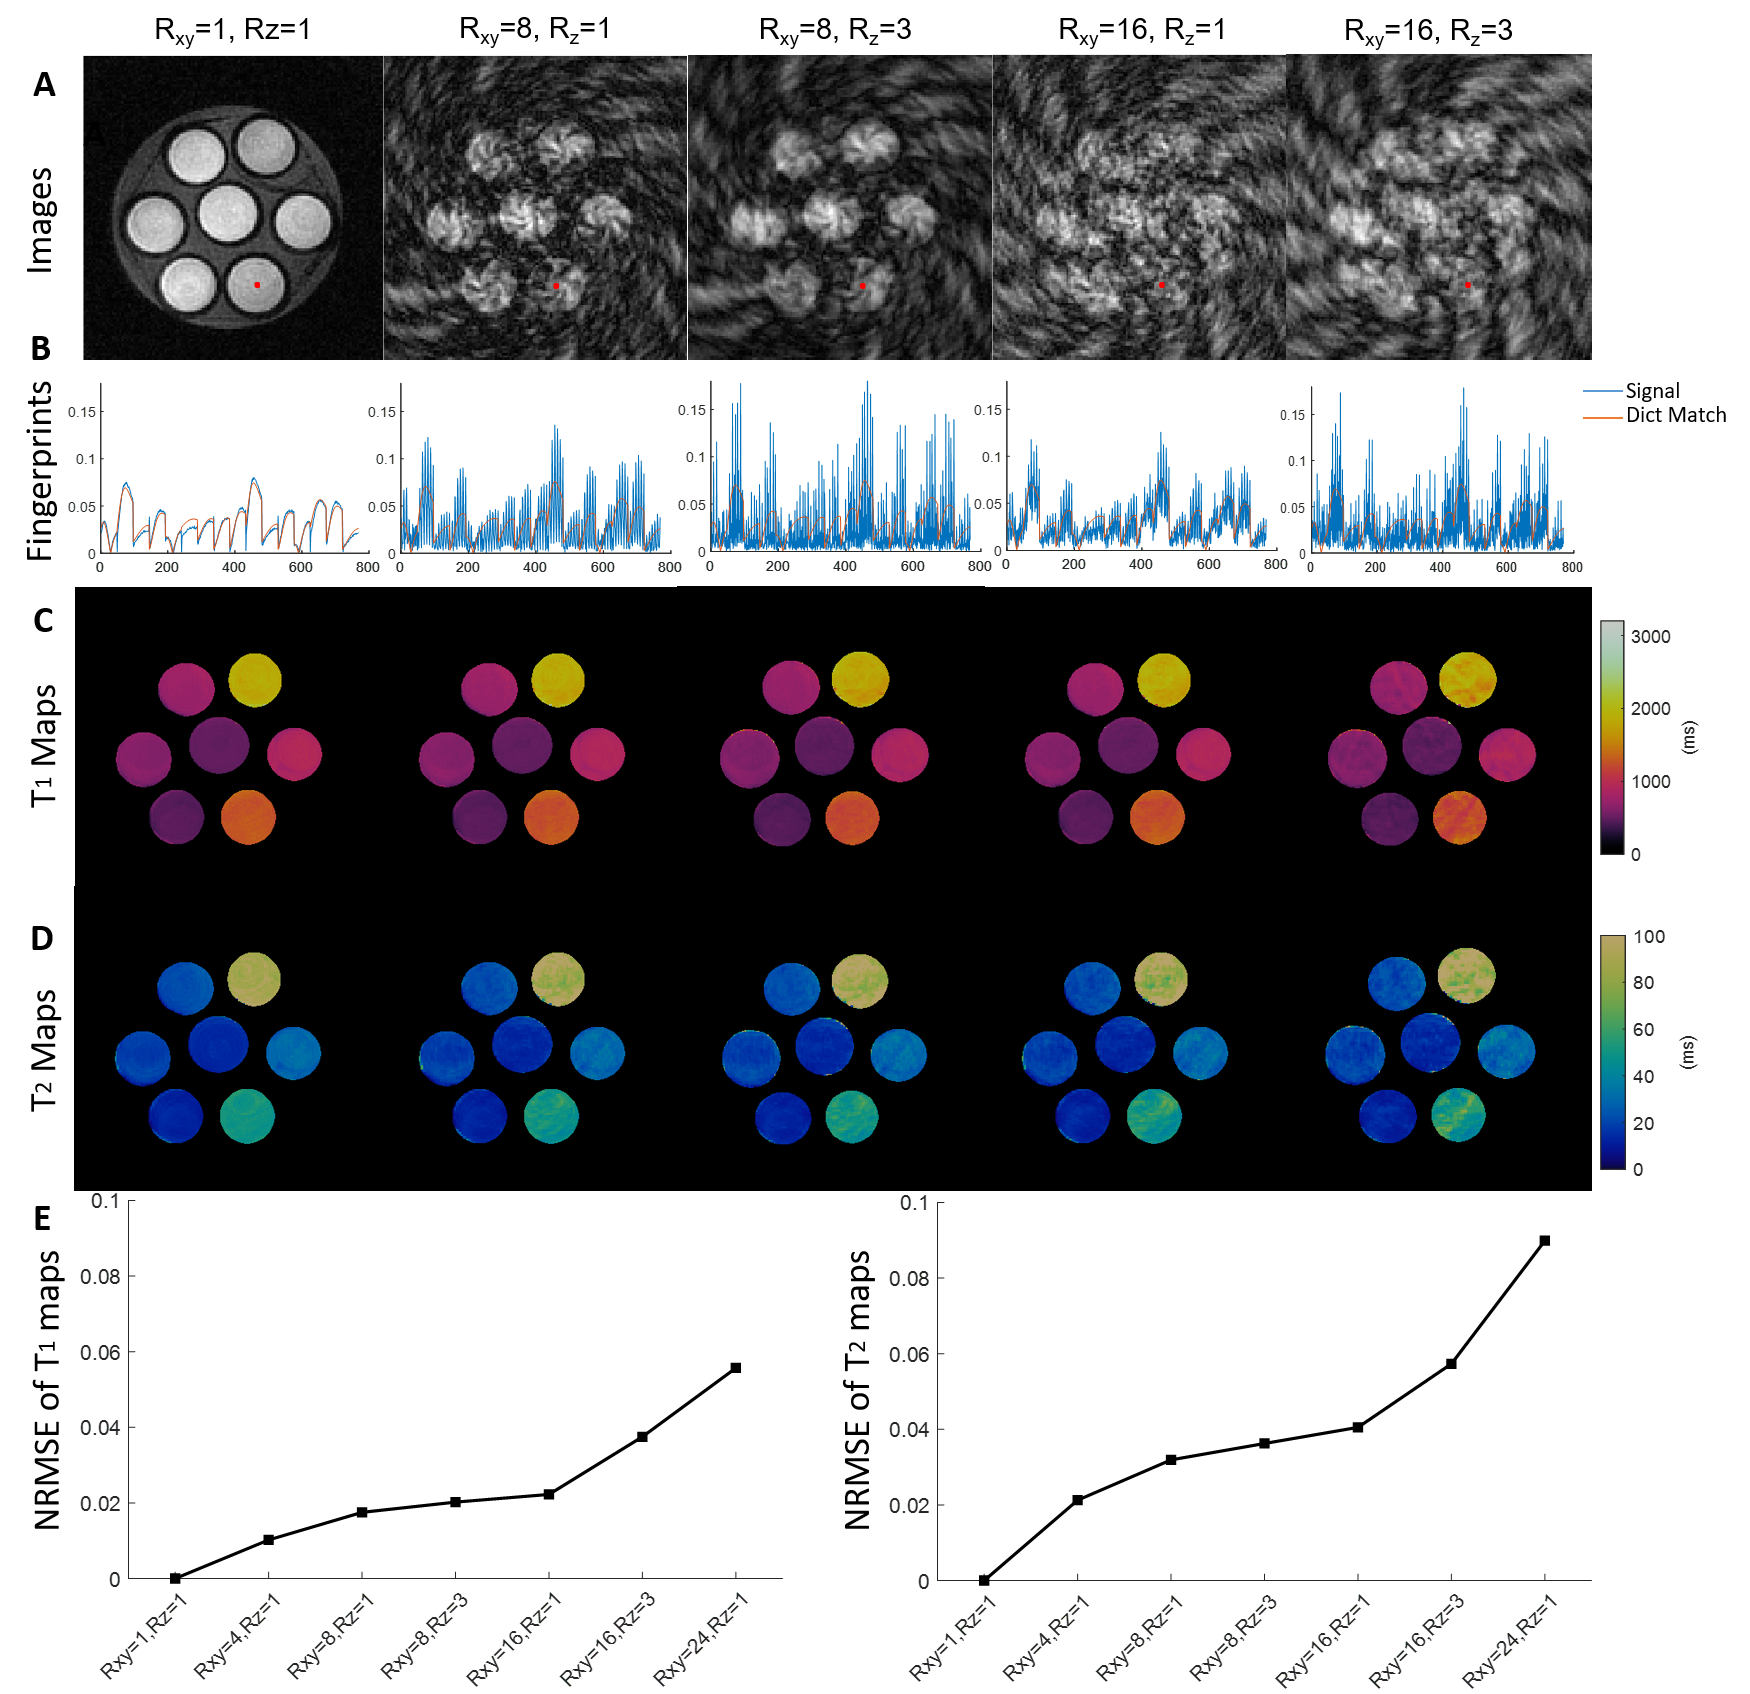
Figure
1. Retrospective
undersampling analysis of fully-sampled phantom data. A. Images of the 120th frame image of a central axial view
reconstructed from fully sampled data (Rxy=1, Rz=1) and
undersampled data (Rxy=8, Rz=1; Rxy=8, Rz=3;
Rxy=16, Rz=1; Rxy=16, Rz=3). B. Plots of fingerprints vs.
dictionary matching results for the pixel highlighted in A. C. T1 maps of fully sampled
and undersampled results. D. T2
maps of fully sampled and undersampled results. E. Normalized RMSE (NRMSE) of T1 and T2 estimations with different
undersampling factors.