Reza Rahmanzadeh1,2,3, Po-Jui Lu1,2,3, Muhamed Barakovic1,2,3, Matthias Weigel1,2,3, Laura Gaetano4, Riccardo Galbusera1,2,3, Thanh D. Nguyen5, Francesco La Rosa 6,7, Daniel S. Reich8, Pascal Sati8,9, Yi Wang5, Meritxell Bach Cuadra6,7, Ernst-Wilhelm Radue1,2, Jens Kuhle1,3, Ludwig Kappos1,3, Stefano Magon10, and Cristina Granziera1,2,3
1Neurologic Clinic and Policlinic, Departments of Medicine, Clinical Research and Biomedical Engineering, University Hospital Basel and University of Basel, Basel, Switzerland, 2Translational Imaging in Neurology (ThINk) Basel, Department of Biomedical Engineering, University Hospital Basel and University of Basel, Basel, Switzerland, 3Research Center for Clinical Neuroimmunology and Neuroscience (RC2NB) Basel, University Hospital Basel and University of Basel, Basel, Switzerland, 4Hoffmann-La Roche Ltd., Basel, Switzerland, 5Department of Radiology, Weill Cornell Medical College, New York, NY, United States, 6Signal Processing Laboratory (LTS5), Ecole Polytechnique Fédérale de Lausanne (EPFL), Laussane, Switzerland, 7Radiology Department, Center for Biomedical Imaging (CIBM), Lausanne University and University Hospital, Laussane, Switzerland, 8Translational Neuroradiology Section, National Institute of Neurological Disorders and Stroke, NIH, 10 Center Drive MSC 1400, Building 10 Room 5C103, Bethesda, MD, United States, 9Department of Neurology, Cedars-Sinai Medical Center, Los Angeles, CA, United States, 10Pharmaceutical Research and Early Development, Roche Innovation Center Basel, F. Hoffmann-La Roche Ltd., Basel, Switzerland
1Neurologic Clinic and Policlinic, Departments of Medicine, Clinical Research and Biomedical Engineering, University Hospital Basel and University of Basel, Basel, Switzerland, 2Translational Imaging in Neurology (ThINk) Basel, Department of Biomedical Engineering, University Hospital Basel and University of Basel, Basel, Switzerland, 3Research Center for Clinical Neuroimmunology and Neuroscience (RC2NB) Basel, University Hospital Basel and University of Basel, Basel, Switzerland, 4Hoffmann-La Roche Ltd., Basel, Switzerland, 5Department of Radiology, Weill Cornell Medical College, New York, NY, United States, 6Signal Processing Laboratory (LTS5), Ecole Polytechnique Fédérale de Lausanne (EPFL), Laussane, Switzerland, 7Radiology Department, Center for Biomedical Imaging (CIBM), Lausanne University and University Hospital, Laussane, Switzerland, 8Translational Neuroradiology Section, National Institute of Neurological Disorders and Stroke, NIH, 10 Center Drive MSC 1400, Building 10 Room 5C103, Bethesda, MD, United States, 9Department of Neurology, Cedars-Sinai Medical Center, Los Angeles, CA, United States, 10Pharmaceutical Research and Early Development, Roche Innovation Center Basel, F. Hoffmann-La Roche Ltd., Basel, Switzerland
Quantitative T1, myelin water imaging and quantitative susceptibility mapping (QSM) show differential sensitivity to multiple sclerosis pathology in white matter and cortical lesions, peri-plaque and normal appearing tissue.
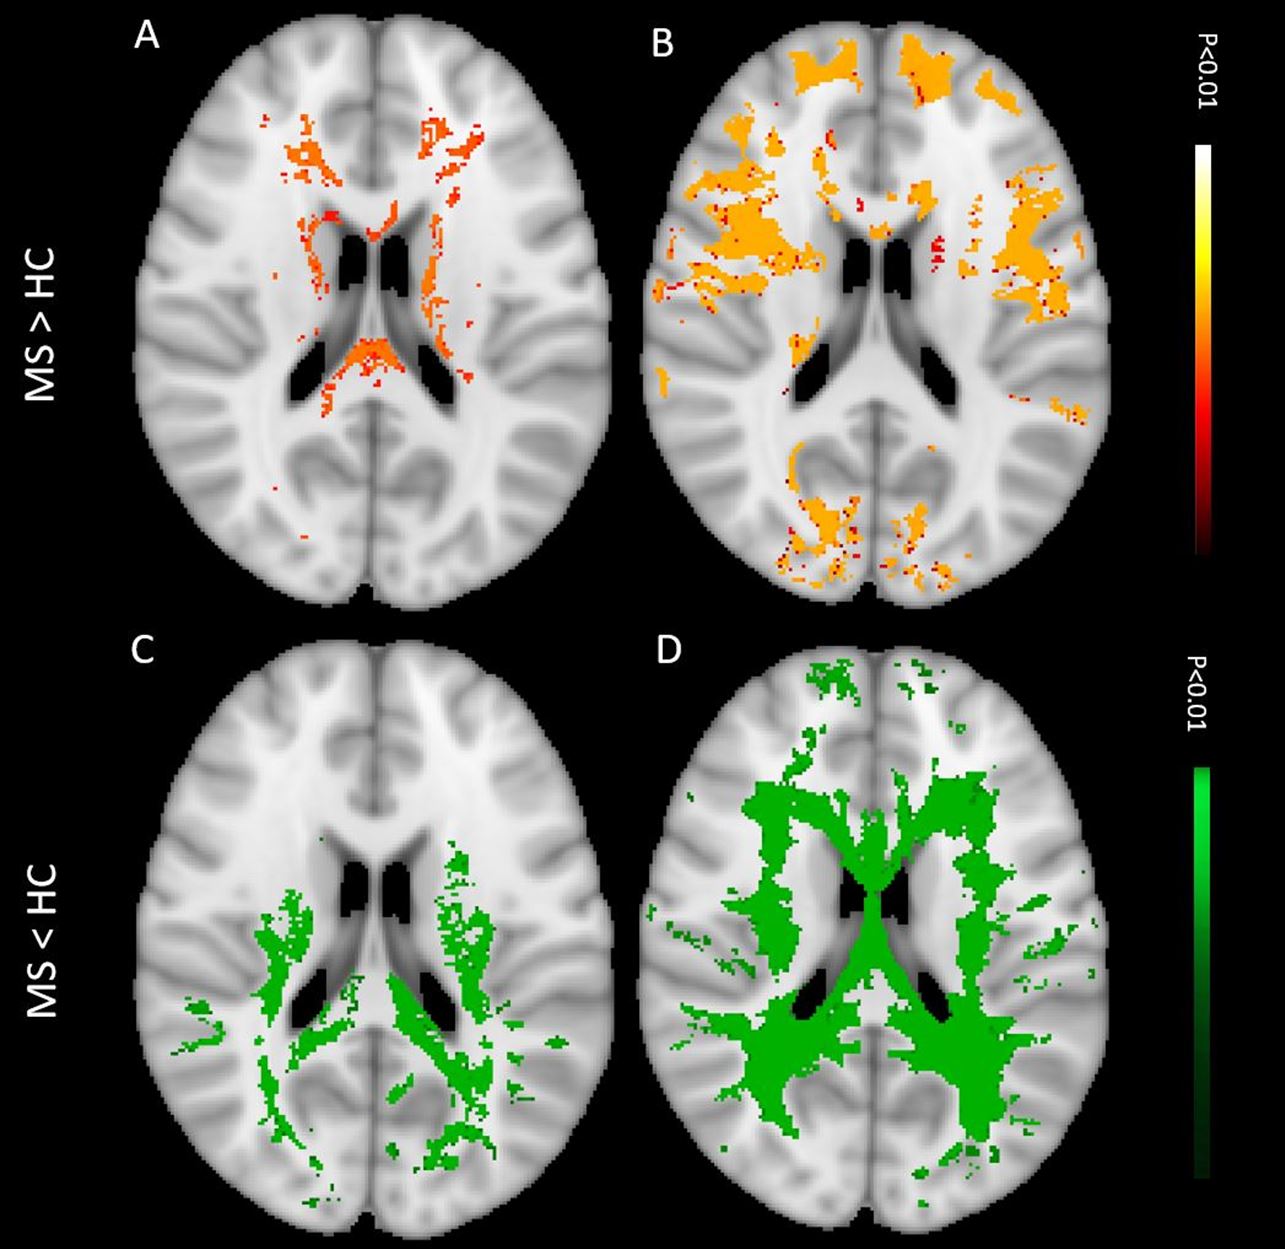
Figure 2. Voxel-wise
randomized clustering comparison between NAWM patients and WM controls in A) qT1,
B,C) QSM and D) MWF and susceptibility, respectively.

Figure 3. Vertex-wise
comparison between NAGM patients and GM controls in A) qT1, B,C) QSM and D) MWF,
respectively.