Xia Ge1, John A Engelbach1, Liya Yuan2, Sonika Dahiya3, Feng Gao4, Keith M Rich2, Joseph JH Ackerman1,5,6,7, and Joel R Garbow1,5
1Radiology, Washington University in St Louis, St Louis, MO, United States, 2Neurosurgery, Washington University in St Louis, St Louis, MO, United States, 3Neuropathology, Washington University in St Louis, St Louis, MO, United States, 4Surgery, Washington University in St Louis, St Louis, MO, United States, 5Alvin J Siteman Cancer Center, Washington University in St Louis, St Louis, MO, United States, 6Internal Medicine, Washington University in St Louis, St Louis, MO, United States, 7Chemistry Department, Washington University in St Louis, St Louis, MO, United States
1Radiology, Washington University in St Louis, St Louis, MO, United States, 2Neurosurgery, Washington University in St Louis, St Louis, MO, United States, 3Neuropathology, Washington University in St Louis, St Louis, MO, United States, 4Surgery, Washington University in St Louis, St Louis, MO, United States, 5Alvin J Siteman Cancer Center, Washington University in St Louis, St Louis, MO, United States, 6Internal Medicine, Washington University in St Louis, St Louis, MO, United States, 7Chemistry Department, Washington University in St Louis, St Louis, MO, United States
A quantitative, clinically translatable 1H MR imaging pipeline has been developed and demonstrated to hold considerable promise for differentiating recurrent tumor from treatment effects (e.g., late time-to-onset necrosis) for high-grade tumor patients treated with radiation.
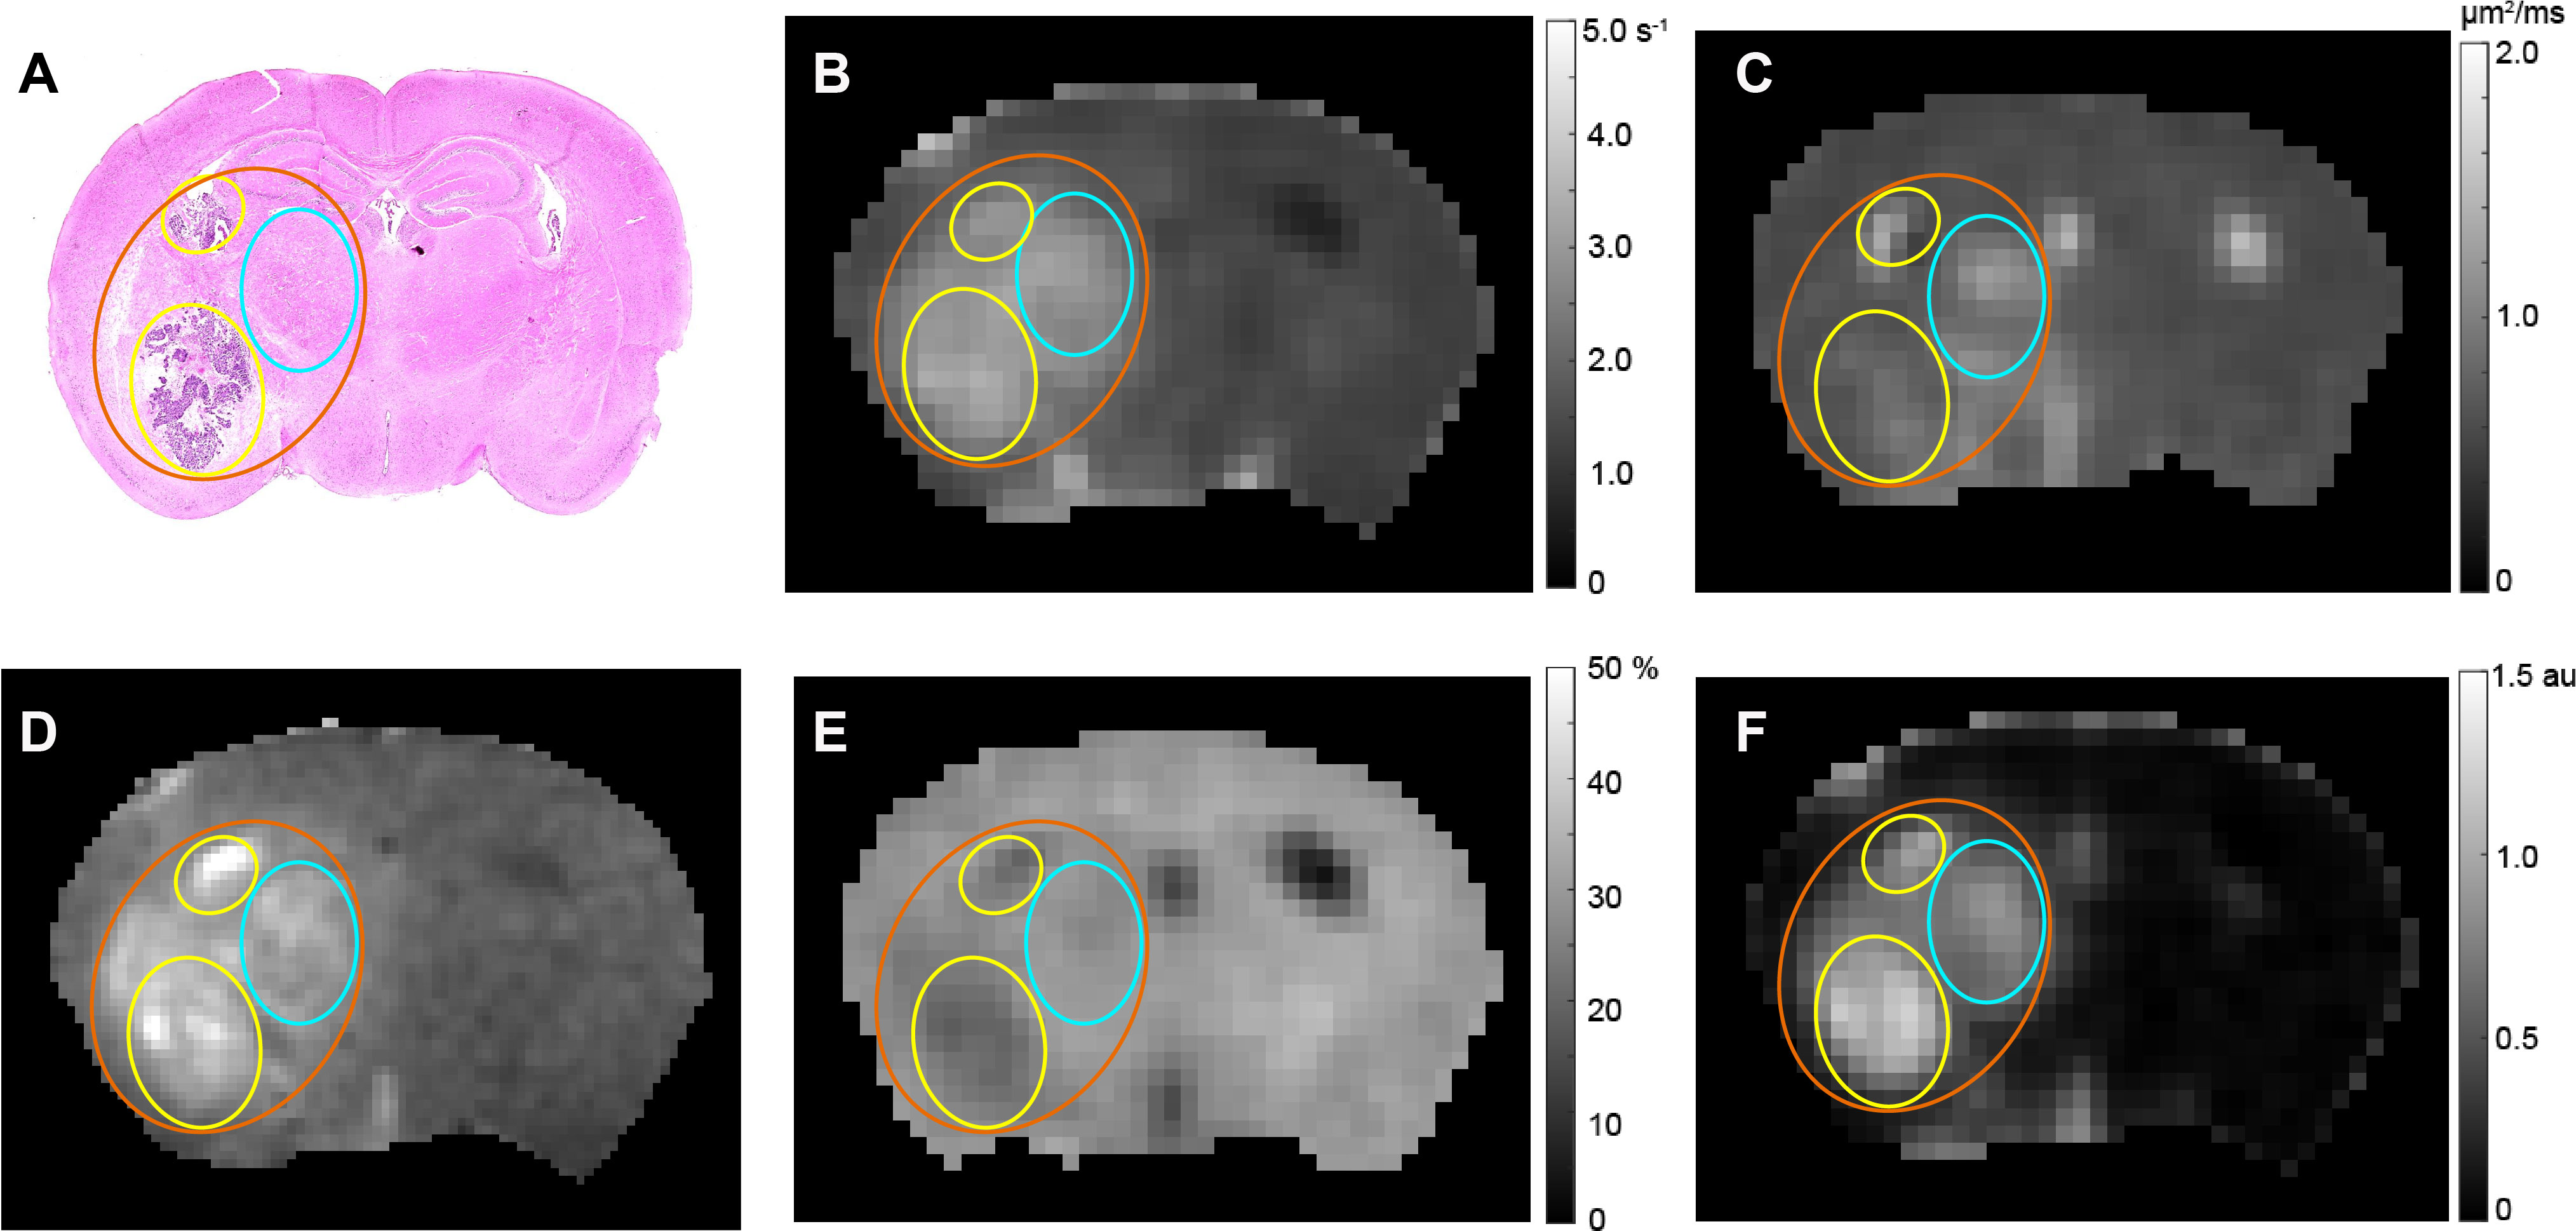
Figure 3. The Mixed Model. A) H&E histology; (B) R1PC map; (C) ADC map; (D) T1WPC; (E) MTR map; (F) DCEAUC map from a slice through the brain of a C57BL/6 mouse irradiated hemispherically with a GK into which GL261 tumor cells were orthotopically implanted 4 weeks post irradiation. Images and histology were collected 18 days post tumor implantation. Regions of pathology (tumor or RN) appear hyperintense on R1PC map, ADC map, T1WPC, and DCEAUC map, while only the tumor is hypointense on the MTR map. The orange-colored oval guides the eye to the whole lesion region, yellow to tumor, cyan to RN.
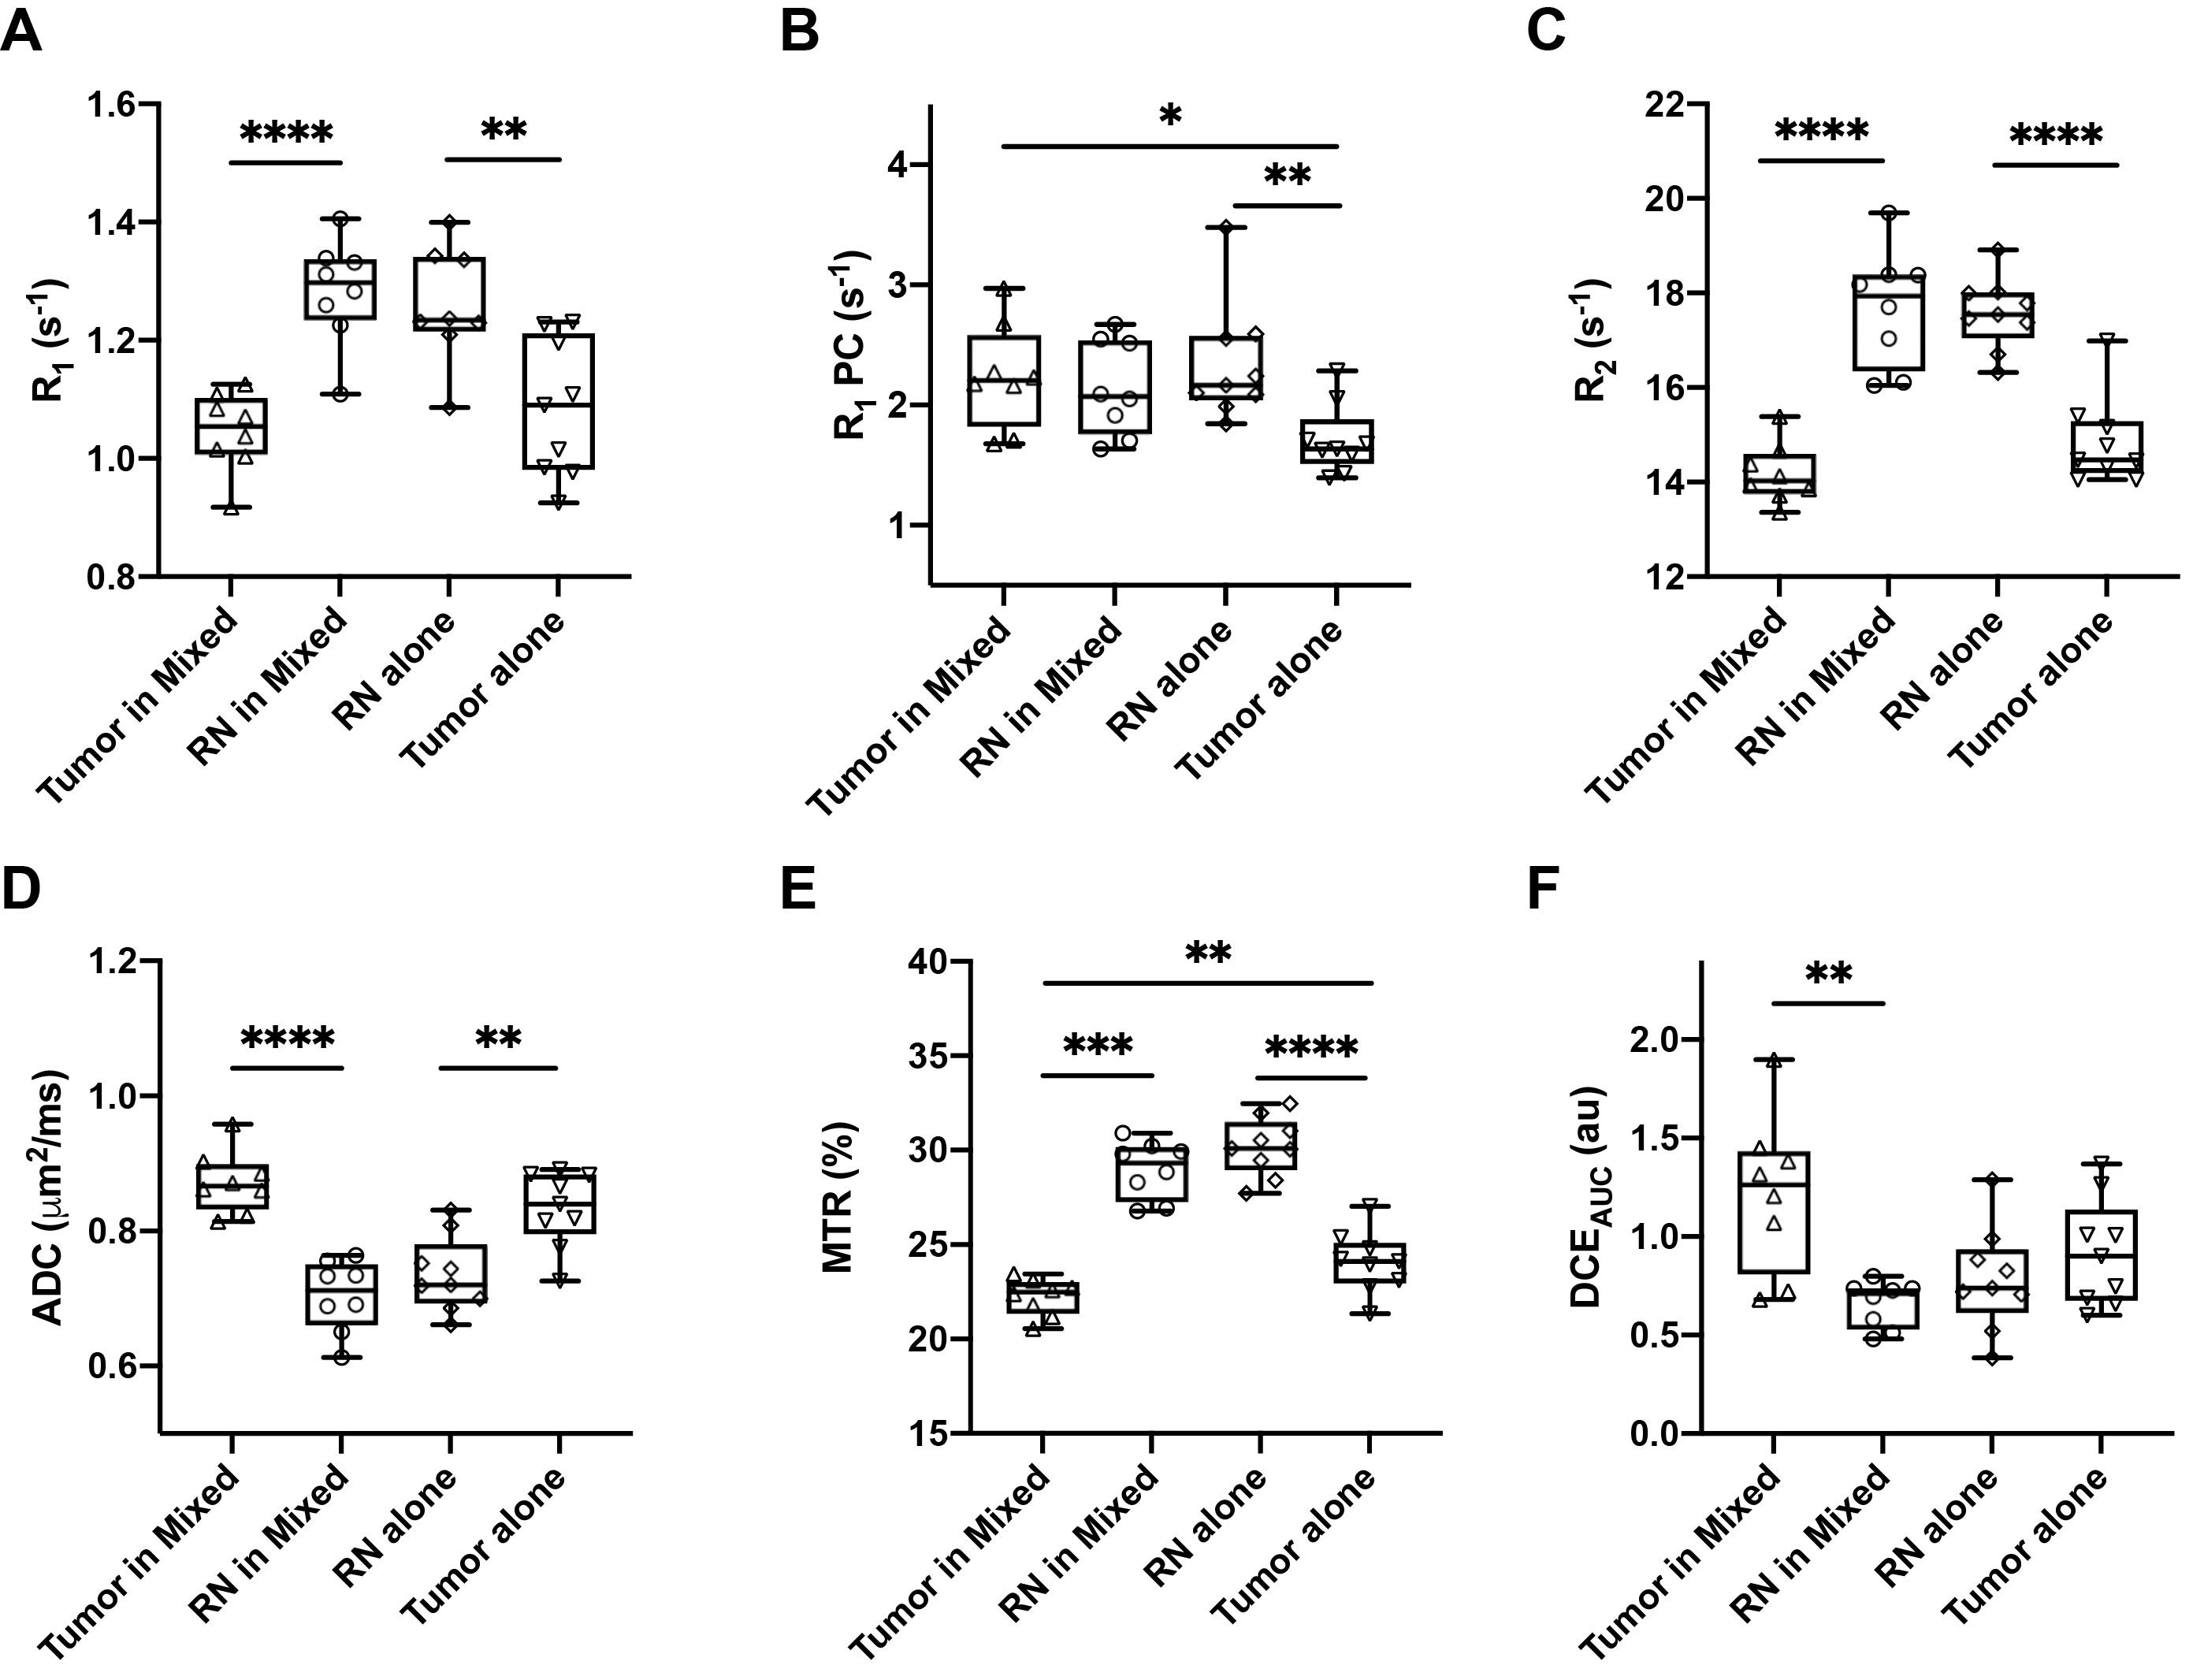
Figure 4: Box plot of MRI parameter means of lesion (tumor/RN) in the mixed, tumor alone and RN alone models. A. R1; B.R1PC; C. R2; D. ADC; E. MTR; F. DCEAUC. Lesion ROIs were identified by histology. Differences in values of R1, R2, ADC, MTR, DCEAUC, for tumor vs. RN in the mixed model are highly statistically significant. Tumor in tumor alone (n=9) and RN in RN alone (n=9), differences in values of R1, R1PC, R2, ADC, MTR are statistically significant. *p < 0.05, **p < 0.01, ****p<0.0001.