Yimei Lu1, Qianfeng Wang2, and Dengbin Wang1
1Department of Radiology, Xinhua Hospital, Shanghai Jiao Tong University School of Medicine, shanghai, China, 2Fudan University, Institute of Science and Technology for Brain-Inspired Intelligence, shanghai, China
1Department of Radiology, Xinhua Hospital, Shanghai Jiao Tong University School of Medicine, shanghai, China, 2Fudan University, Institute of Science and Technology for Brain-Inspired Intelligence, shanghai, China
Our study was to investigate the
repeatability of the quantitative parameters at 11.7T, and then to explore the changes of the quantitative parameters in liver fibrosis induced by BDL and injection of CCl4, and to evaluate the performance of quantitative parameters for staging
liver fibrosis.
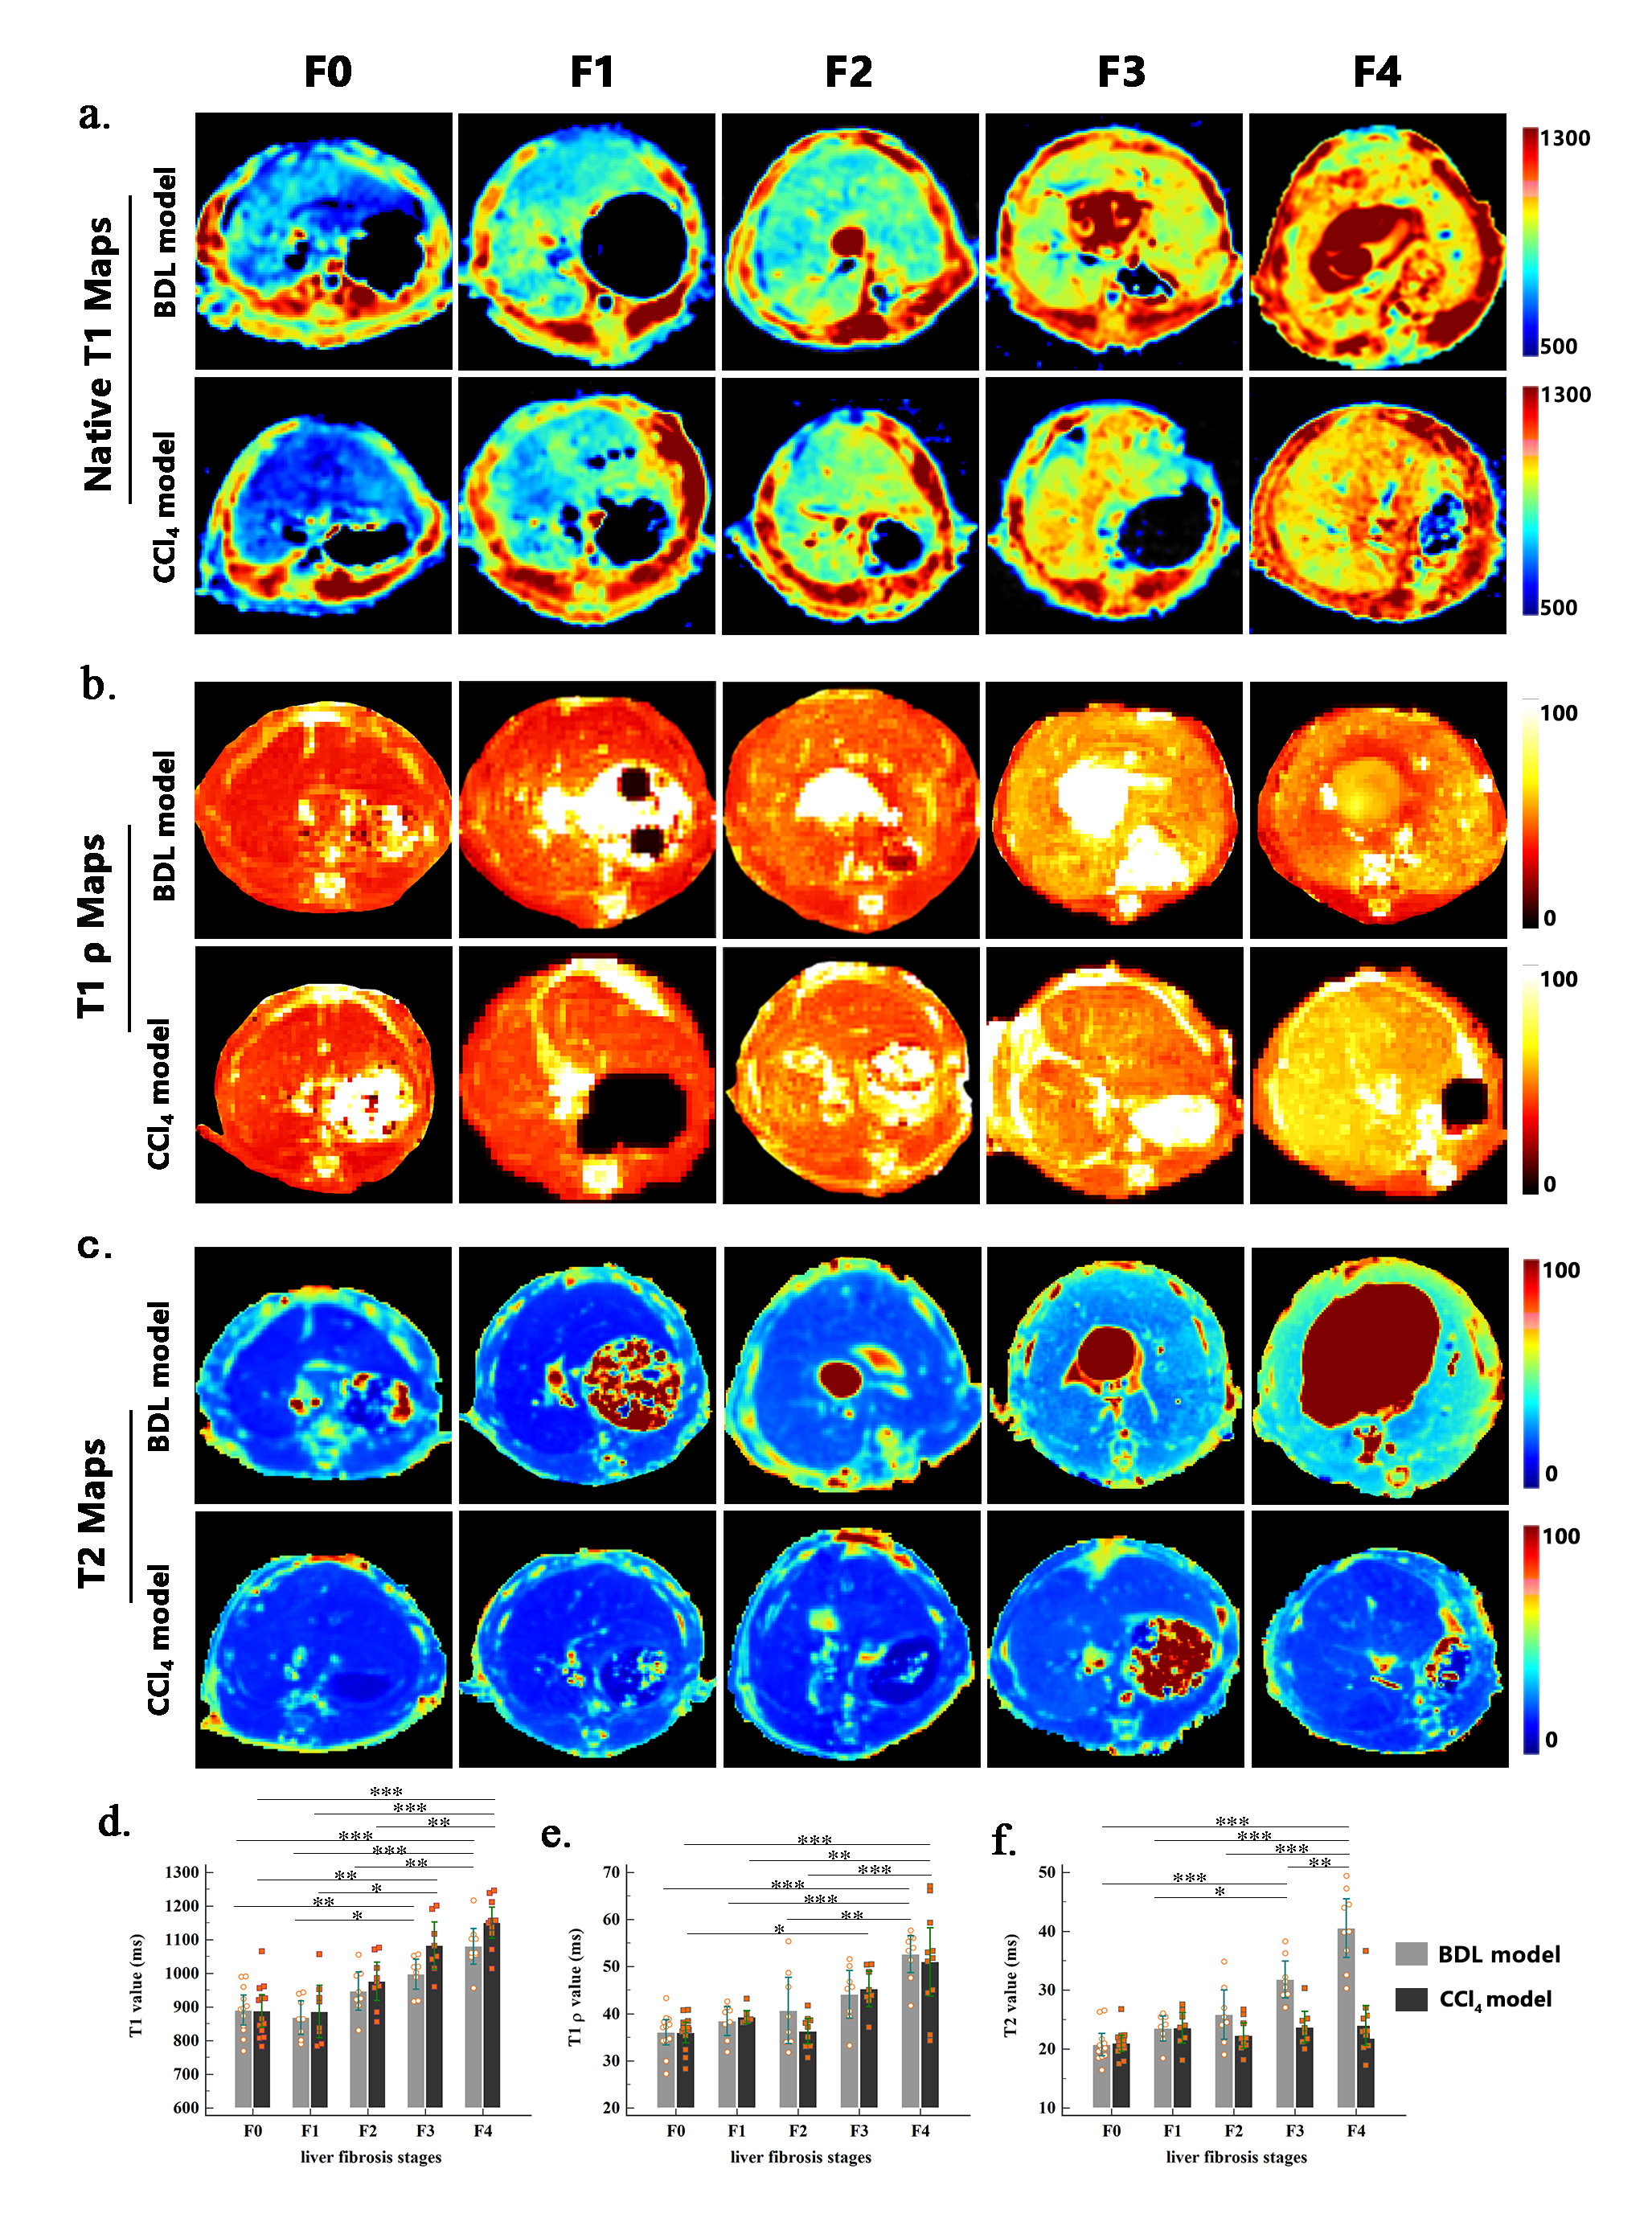
Fig 3. Images show MRI measurements in vivo for BDL and CCl4 model of liver fibrosis. Representative
axial images of (a) native T1 maps, (b) T1 ρ maps
and (c) T2 maps for each group (Metavir stages F0-F4). The images (d-f)
show the corresponding data for all rats in BDL and CCl4 model. One-way
ANOVA followed by Scheffe post hoc test was performed. *P < 0.05, **P <
0.01, ***P < 0.001.
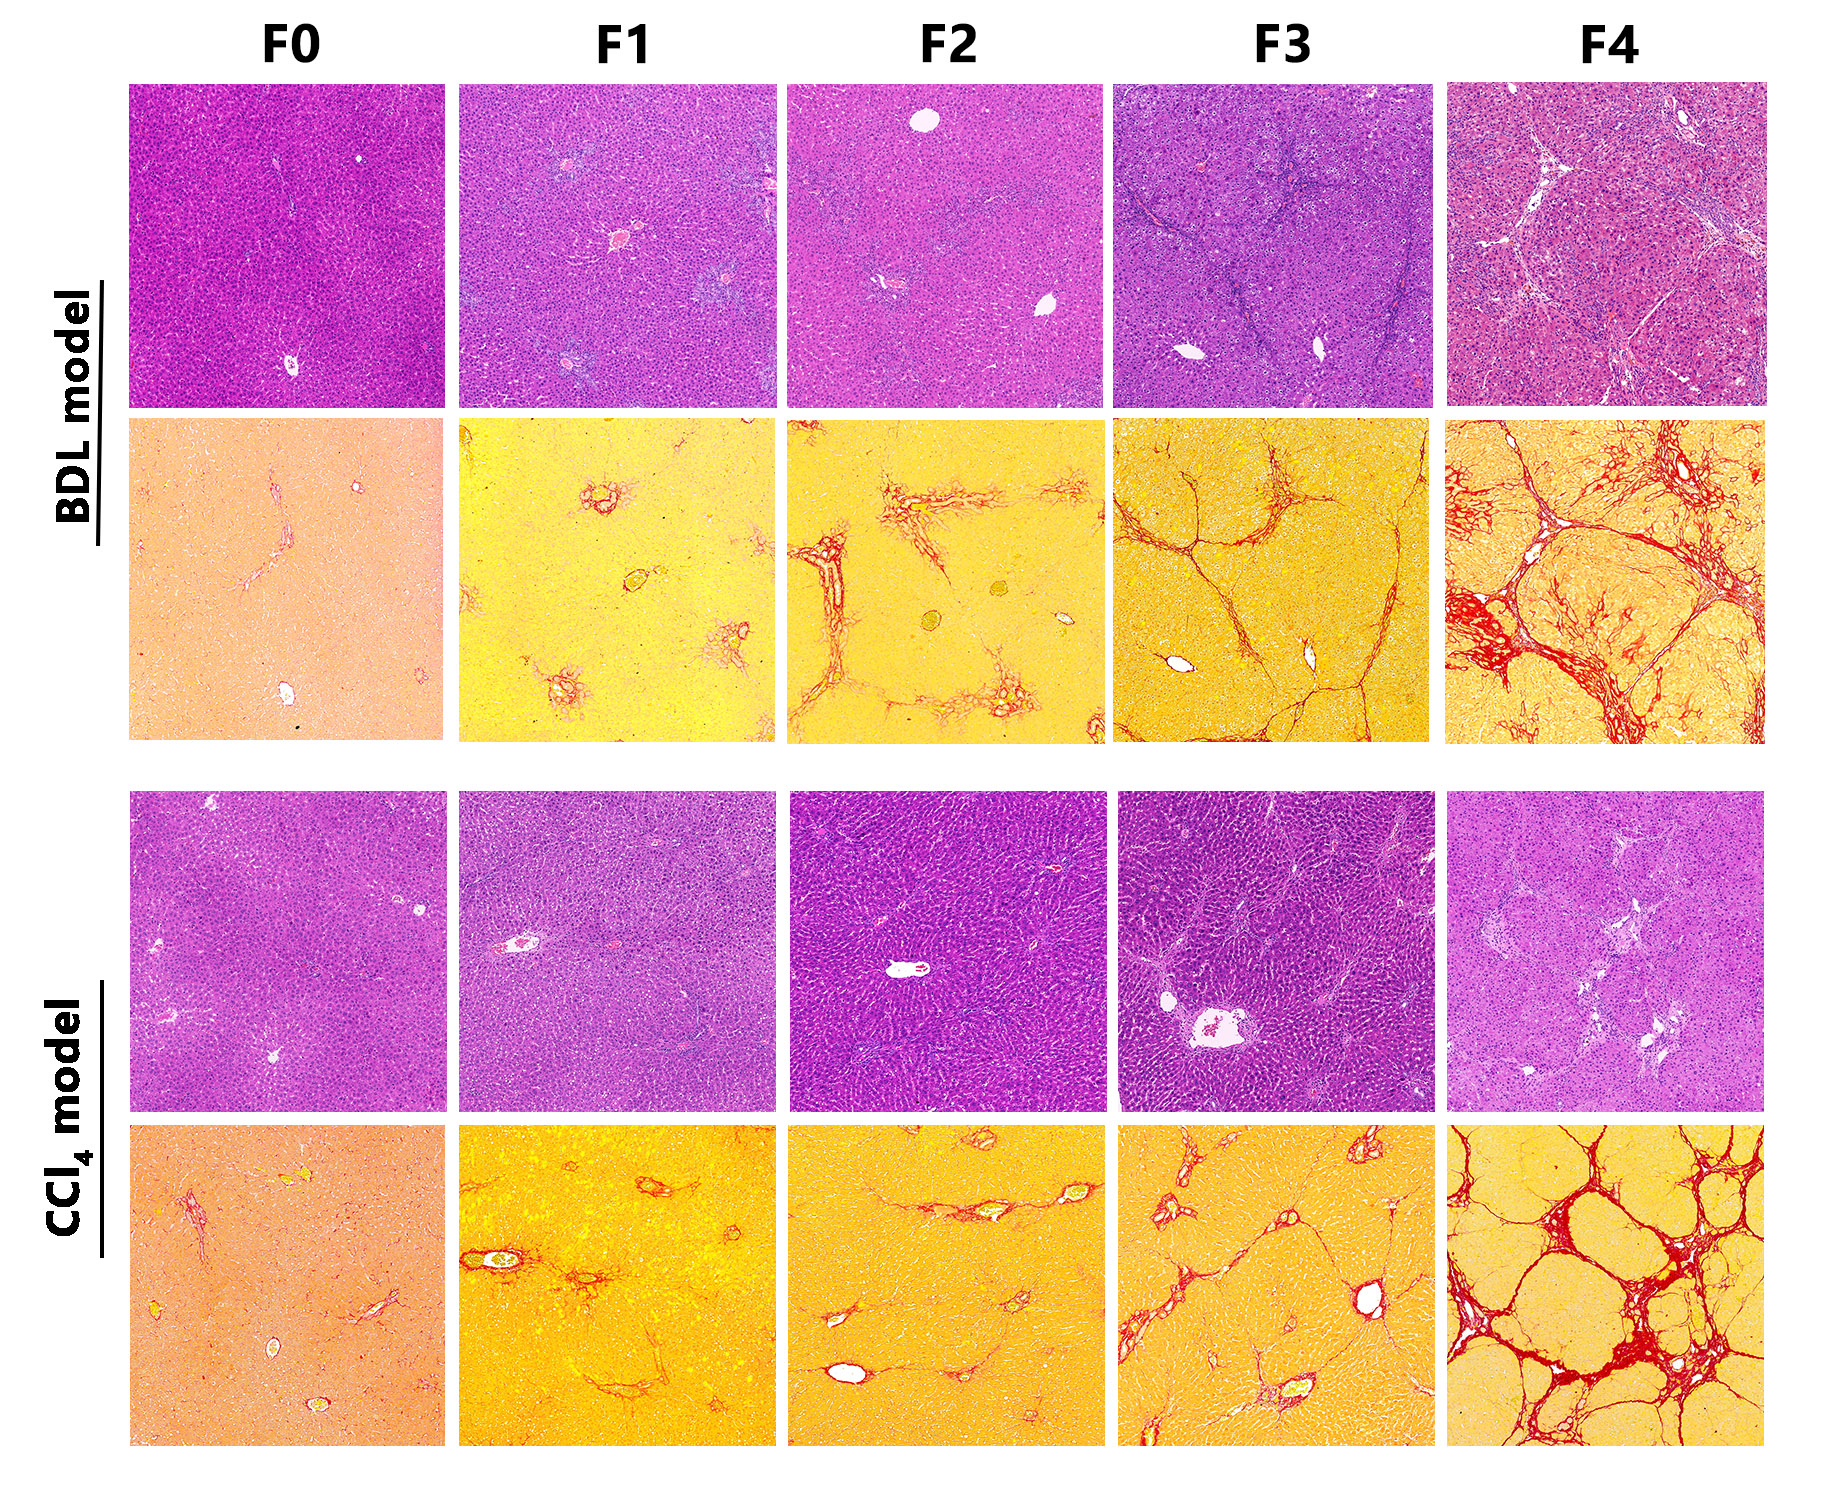
Fig 1. Images
show liver specimens characterization of changes in fibrosis (Metavir
stages F0-F4) in BDL and CCl4 model. Representative images of
H&E-stained (top row) and Sirius red-stained (bottom row) liver tissue from
each experimental group. H&E, hematoxylin and eosin, 200×original magnification; Sirius red stain, 200×original
magnification. CCl4, carbon tetrachloride; BDL, bile duct
ligation