Holly Doig1, Maaike van den Boomen1,2,3, Erin Connors1, Joan Kim1, Jaume Coll-Font1,3, Robert A. Eder1, Shi Chen1, Yoshiko Iwamoto1, Kyrre E. Emblem4, Kawin Setsompop3, Niek H.J. Prakken2, Ronald J.H. Borra2,5, and Christopher T. Nguyen1,3
1Cardiovascular Research Center, Massachusetts General Hospital, Boston, MA, United States, 2Department of Radiology, University Medical Center Groningen, Groningen, Netherlands, 3A.A. Martinos Center for Biomedical Imaging, Massachusetts General Hospital, Boston, MA, United States, 4Department of Diagnostic Physics, Oslo University Hospital, Oslo, Norway, 5Department of Nuclear Medicine and Molecular Imaging, University Medical Center Groningen, Groningen, Netherlands
1Cardiovascular Research Center, Massachusetts General Hospital, Boston, MA, United States, 2Department of Radiology, University Medical Center Groningen, Groningen, Netherlands, 3A.A. Martinos Center for Biomedical Imaging, Massachusetts General Hospital, Boston, MA, United States, 4Department of Diagnostic Physics, Oslo University Hospital, Oslo, Norway, 5Department of Nuclear Medicine and Molecular Imaging, University Medical Center Groningen, Groningen, Netherlands
Comprehensive multiparametric cardiac MRI tissue phenotyping (LGE, T1, T2, DWI, BOLD and VAI) of acute myocardial infarction in swine show that only LGE, T2, and BOLD consistently detect acute infarct. Both T1 and DWI were moderately elevated but not significant across all groups.
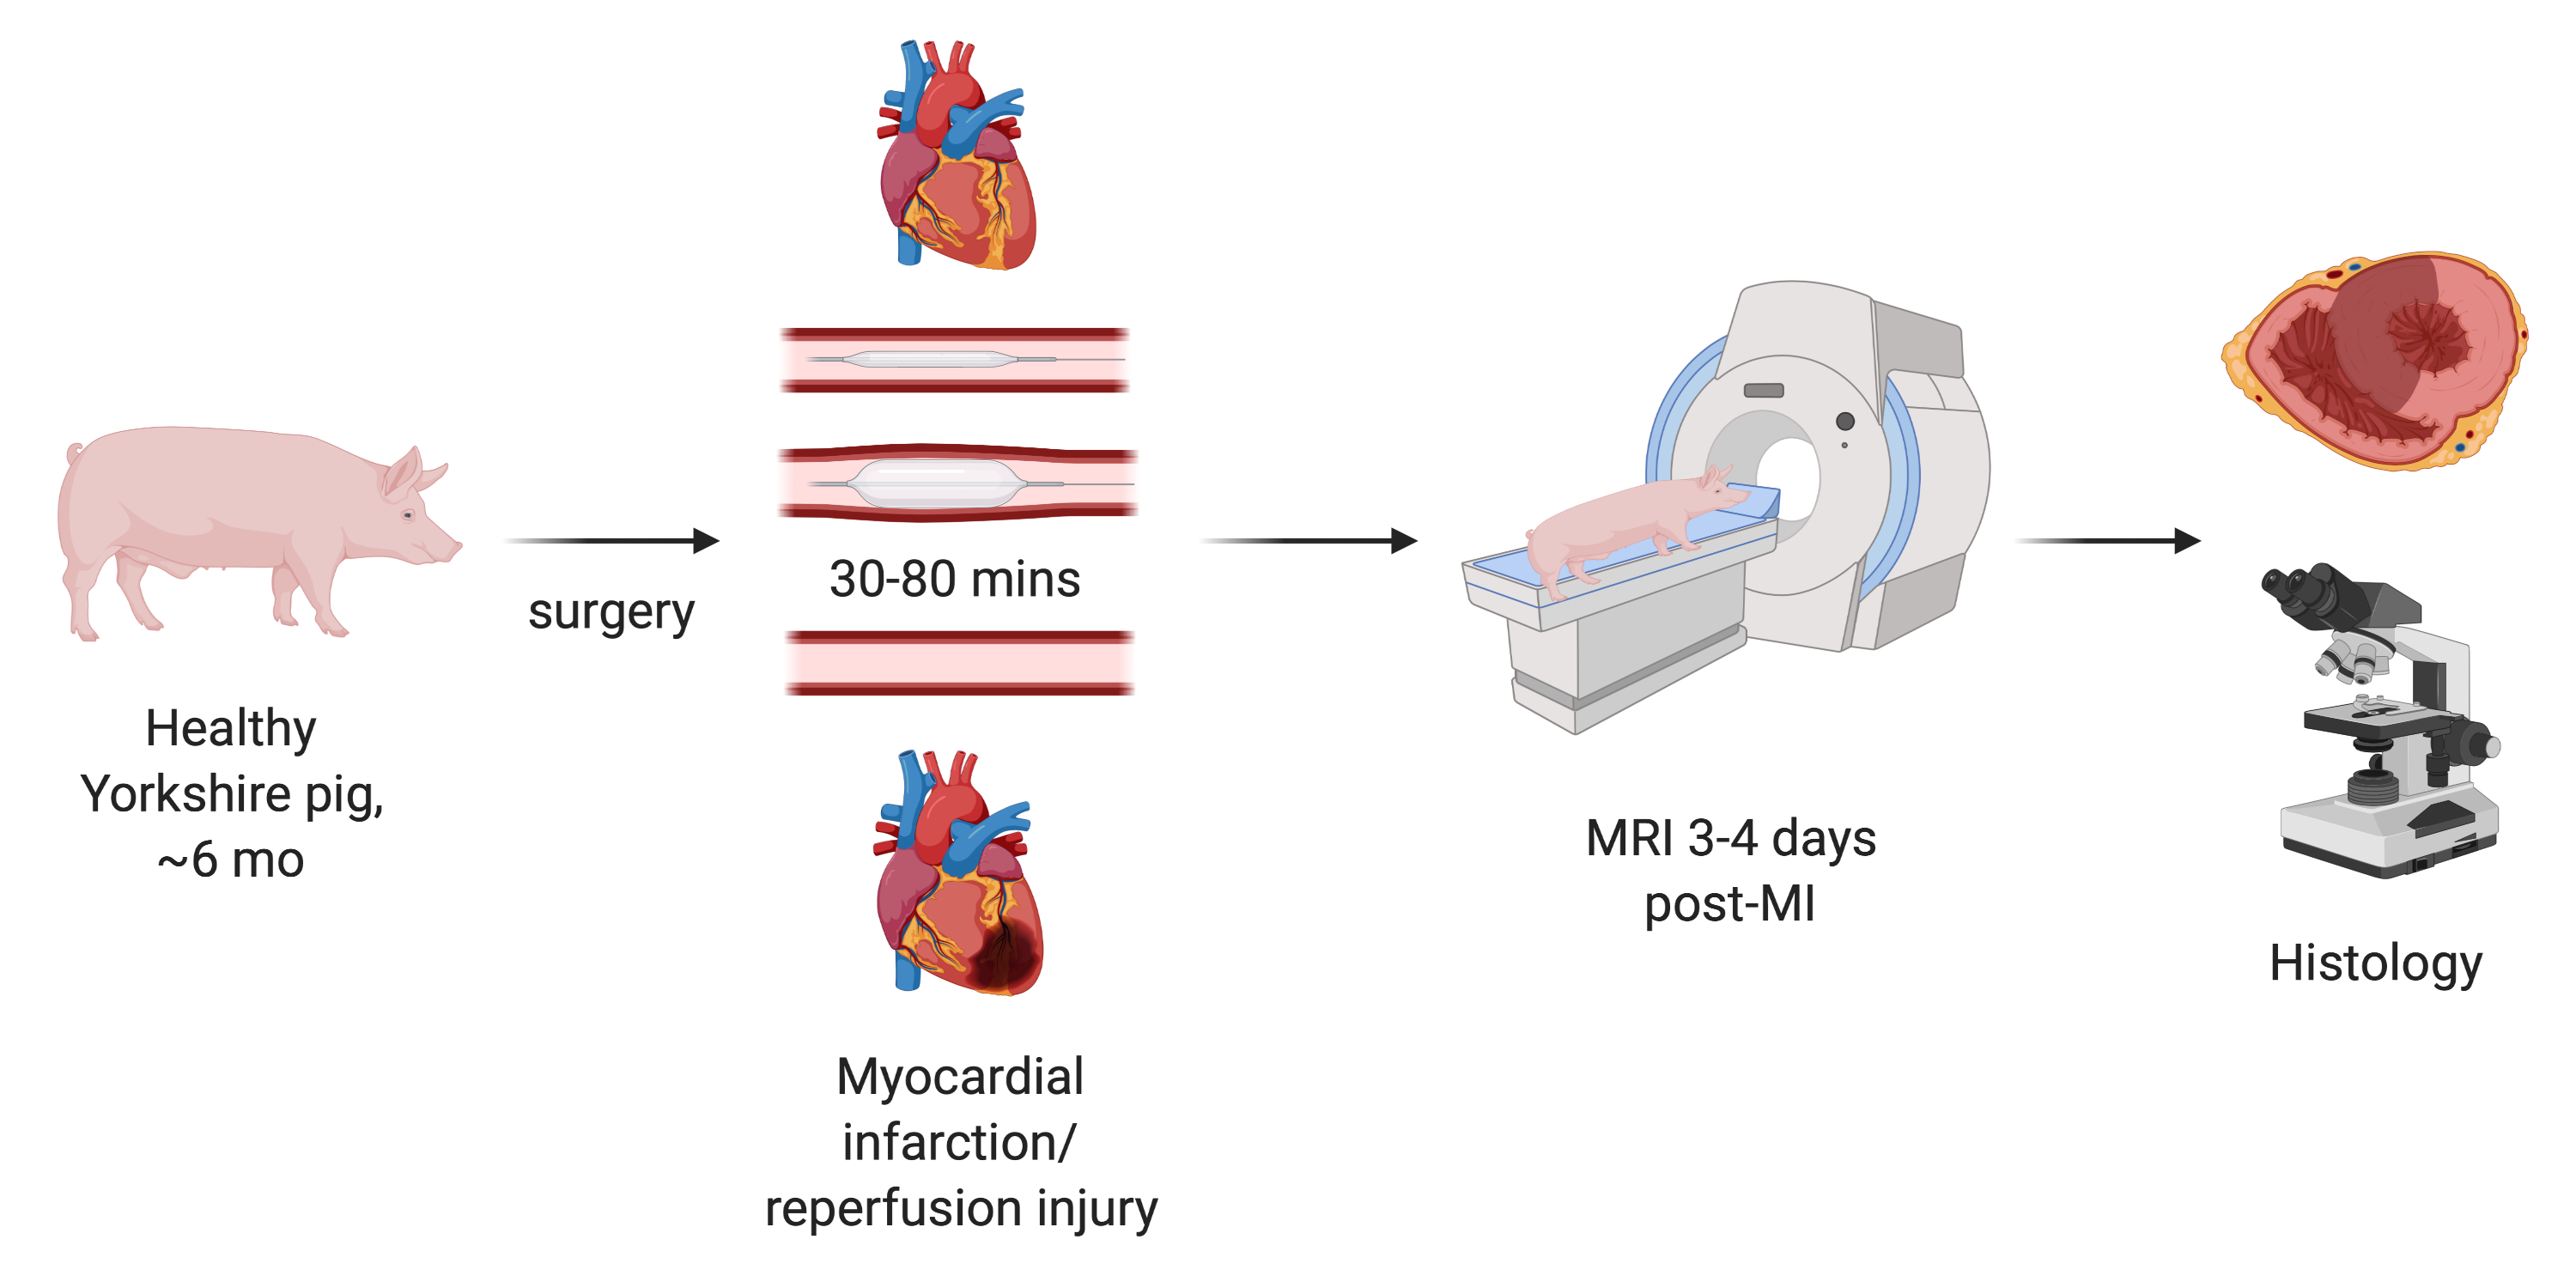
Figure 1 - Overall study design of inducing myocardial infarction in Yorkshire pigs and imaging 3 days post MI before sacrificing animal to perform histological validaiton.
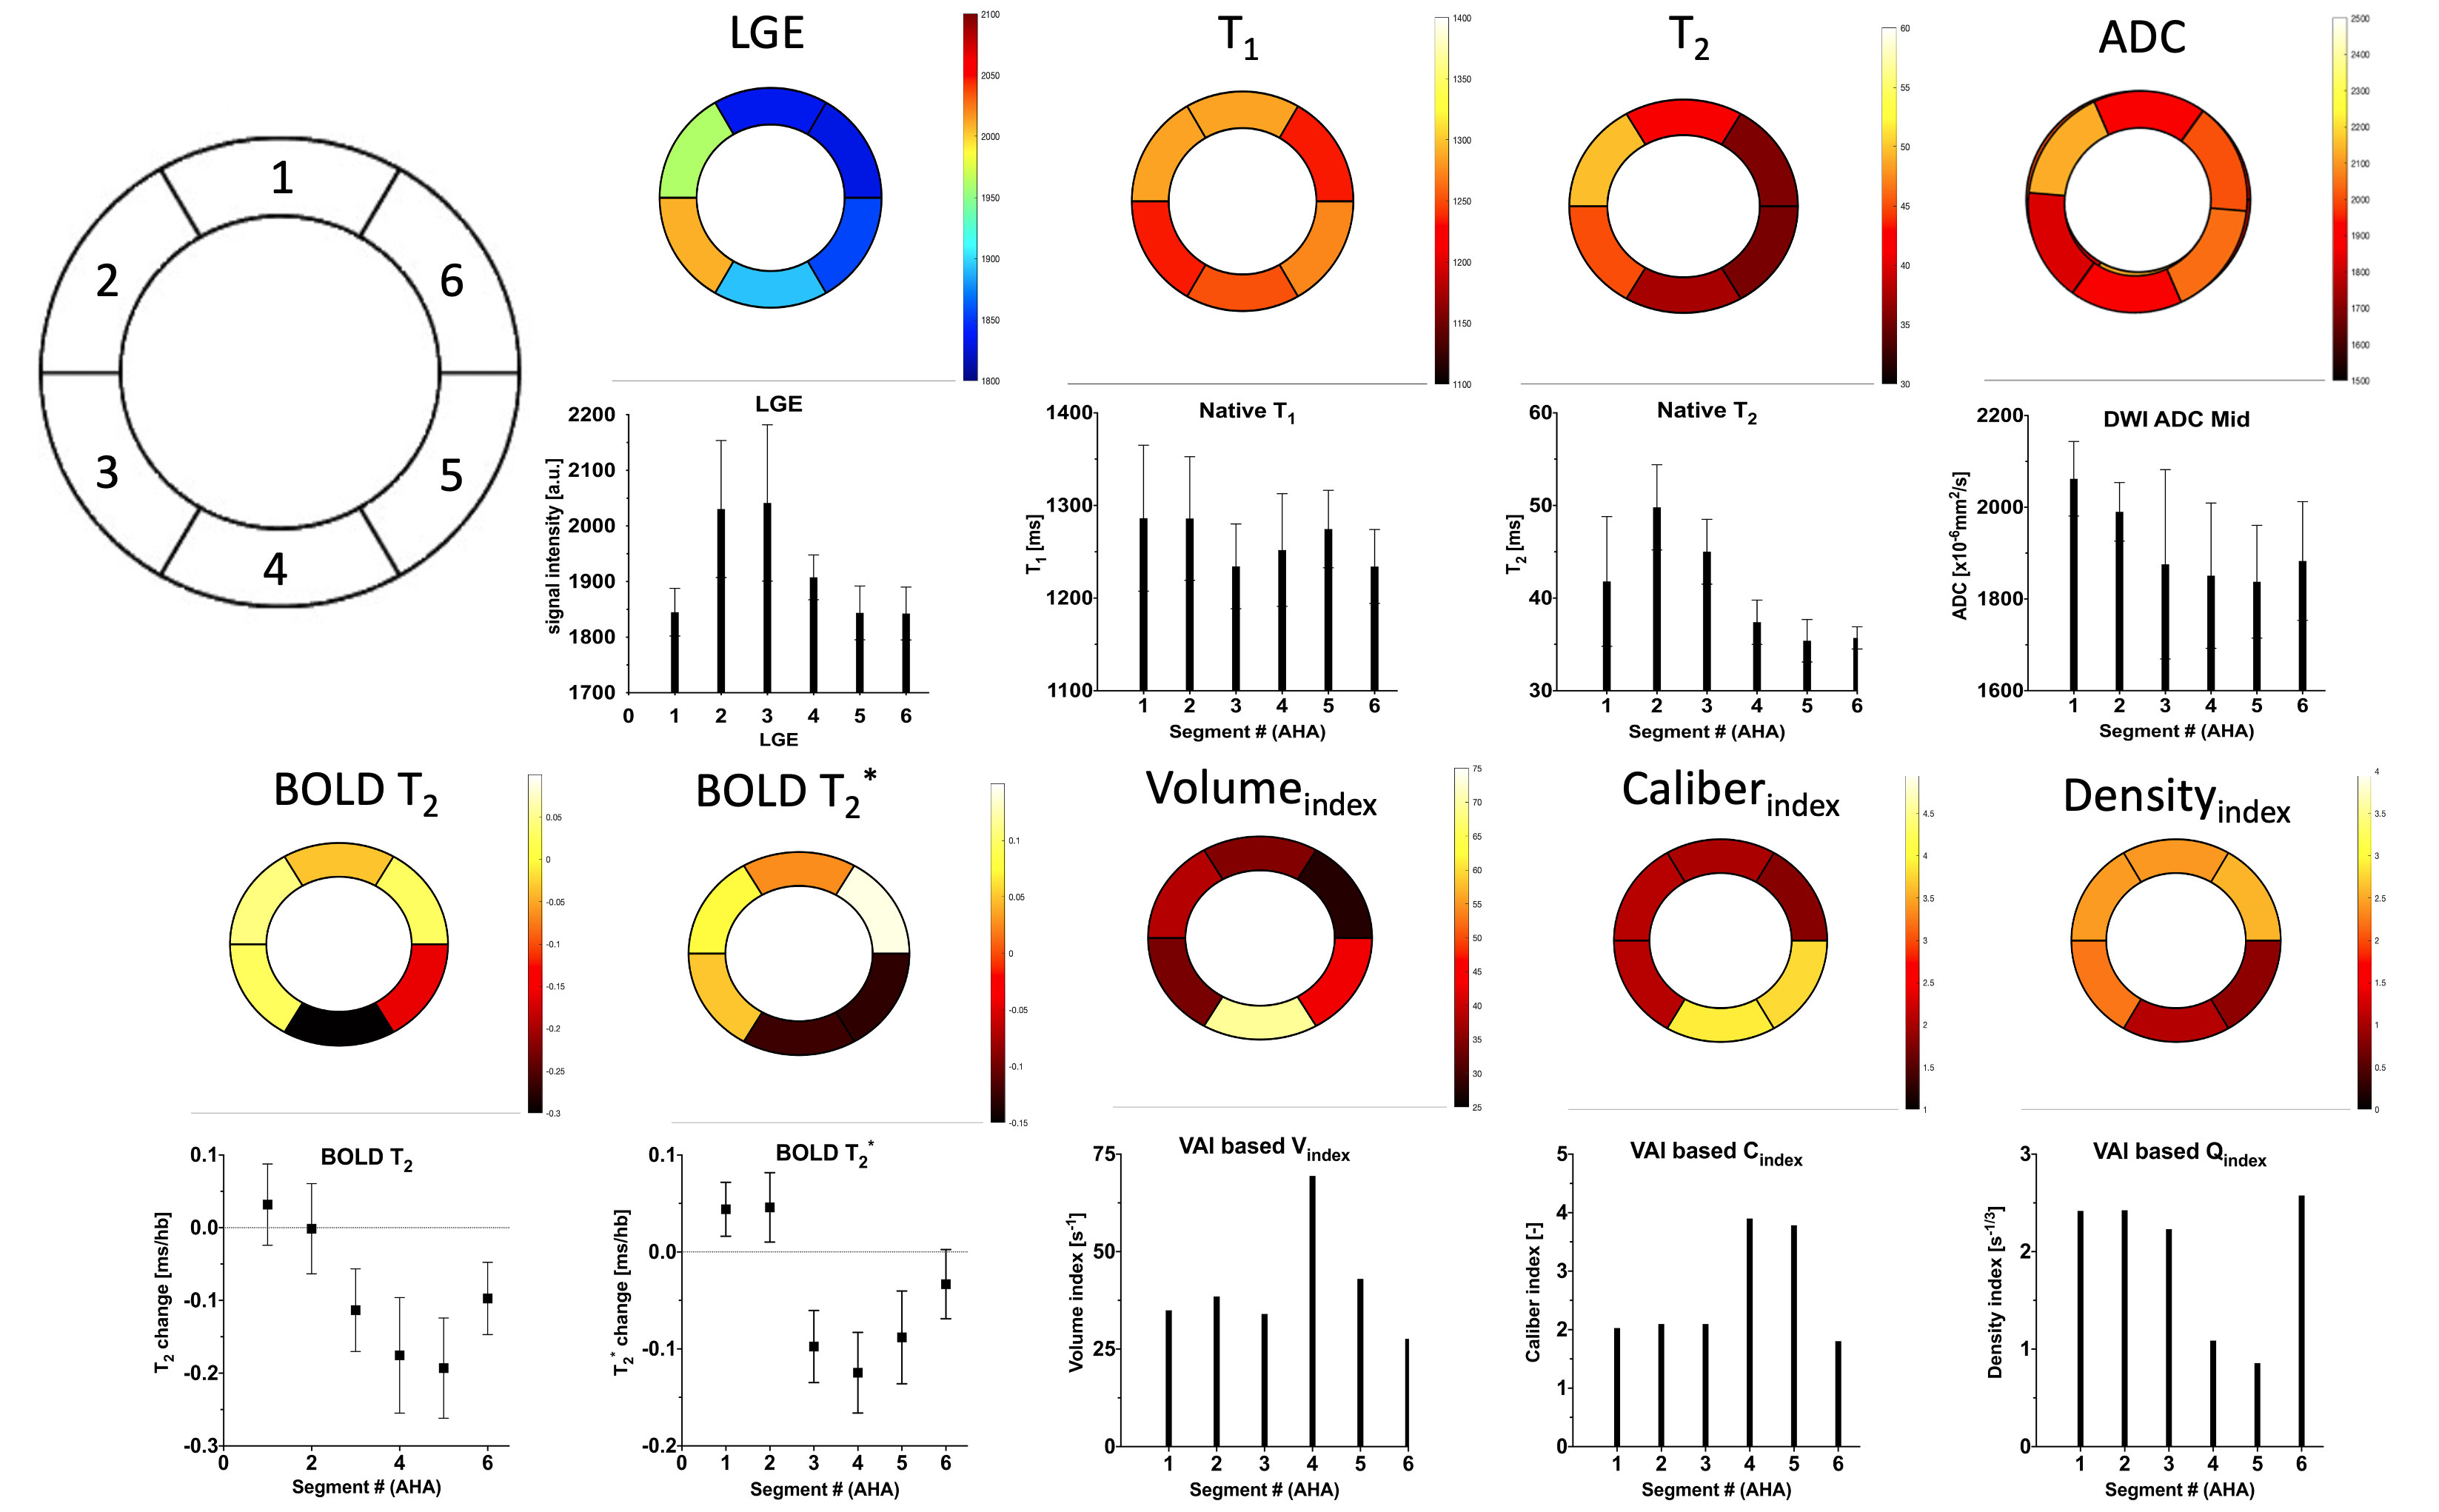
Figure 3 – Polar AHA plots of example animal with corresponding segment based bar graphs. With a visible increased segment 2 and 3 (2036±132 [a.u]) in the LGE plot indicating the infarct and segment 5 as remote segment (SI of 1844±48 [a.u.]). The T1 in those segments was non-significantly increase to 1260±56ms but the remote segment also showed a high T1 value of 1275±42ms. The infarct T2 was 48±4ms, which was a significant increase compared to the remote 35±2ms. The ADC values was also increased 1933±95.25x10⁻⁶mm2/s compared to 1839±123x10-6mm2/s in the remote, but was not significant.