Mitsuki Rikitake1, Junichi Hata2, Fumiko Seki3, Shinsuke Ishigaki4, Kuniyuki Iwata-Endo4, Nobuyuki Iwade4, Takako Shirakawa1, Hirotaka James Okano2, Hideyuki Okano5, and Gen Sobue4
1Department of Redioligical Science, Human Health Science, Tokyo Metroplitan University, Tokyo, Japan, 2Jikei University Graduate School of Medicine, Tokyo, Japan, 3Central Institute for Experimental Animals, Kanagawa, Japan, 4Department of Neurology, Nagoya University Graduate School of Medicine, Nagoya, Japan, 5RIKEN Center of Brain Science, Saitama, Japan
1Department of Redioligical Science, Human Health Science, Tokyo Metroplitan University, Tokyo, Japan, 2Jikei University Graduate School of Medicine, Tokyo, Japan, 3Central Institute for Experimental Animals, Kanagawa, Japan, 4Department of Neurology, Nagoya University Graduate School of Medicine, Nagoya, Japan, 5RIKEN Center of Brain Science, Saitama, Japan
We analyzed the degenerate in cranial nerve structure and change brain function in the marmoset FTLD model. Image analysis using structural MRI detected gray matter degeneration.Further, fMRI detected decrease in activity of the brain region, which was correlated with brain degeneration.
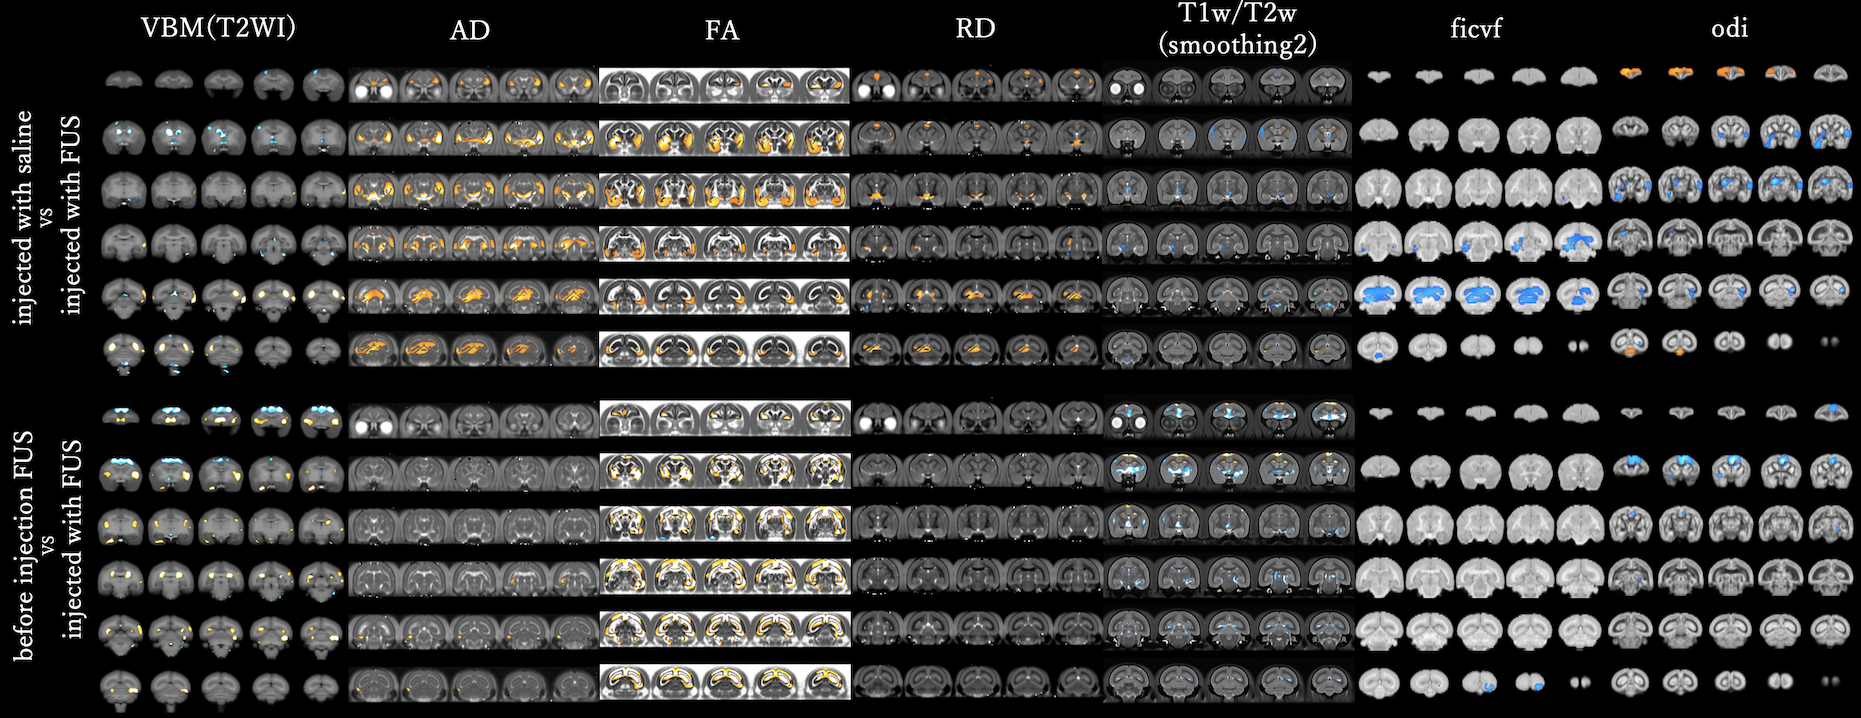
The results of image analysis of VBM and VBA in GM are shown.The cross-sectional image is a coronal image.In VBA analysis, from left to right, AD/FA/RD in DTI analysis, and ODI/FICVF in NODDI analysis are presented.For each image parameter, if group injected with FUS is significantly higher(p<0.05) with respect to group injected with saline (upper) before injection FUS (lower), it is represented as red, and if group injected with FUS is significantly lower(p<0.05), it is represented as blue.
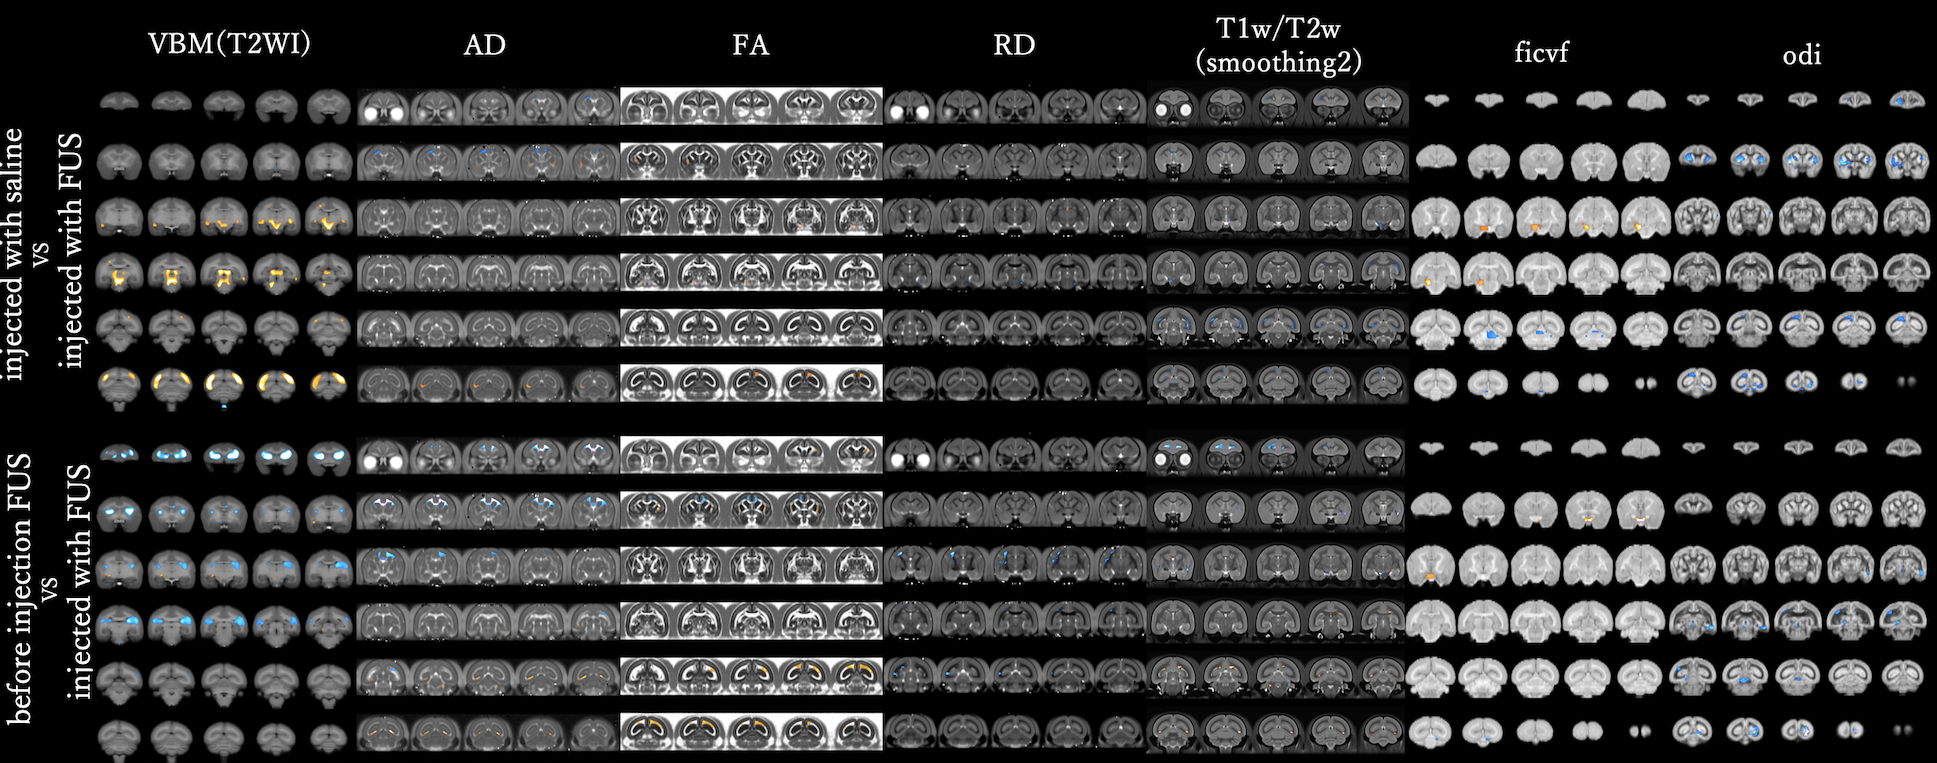
The results of image analysis of VBM and VBA in WM are shown.The cross-sectional image is a coronal image.In VBA analysis, from left to right, AD/FA/RD in DTI analysis, and ODI/FICVF in NODDI analysis are presented.For each image parameter, if group injected with FUS is significantly higher(p<0.05) with respect to group injected with saline (upper) before injection FUS (lower), it is represented as red, and if group injected with FUS is significantly lower(p<0.05), it is represented as blue.