Baolin Wu1, Feifei Zhang1, Zhiyun Jia1,2, and Qiyong Gong1,3
1Huaxi MR Research Center (HMRRC), Department of Radiology, West China Hospital of Sichuan University, Chengdu, China, 2Department of Nuclear Medicine, West China Hospital of Sichuan University, Chengdu, China, 3Psychoradiology Research Unit of Chinese Academy of Medical Sciences (2018RU011), Chengdu, China
1Huaxi MR Research Center (HMRRC), Department of Radiology, West China Hospital of Sichuan University, Chengdu, China, 2Department of Nuclear Medicine, West China Hospital of Sichuan University, Chengdu, China, 3Psychoradiology Research Unit of Chinese Academy of Medical Sciences (2018RU011), Chengdu, China
Our study demonstrated
altered dynamic functional connectivity properties in patients with end-stage
renal disease, and the number of transitions were correlated with cognitive
performance in those patients.
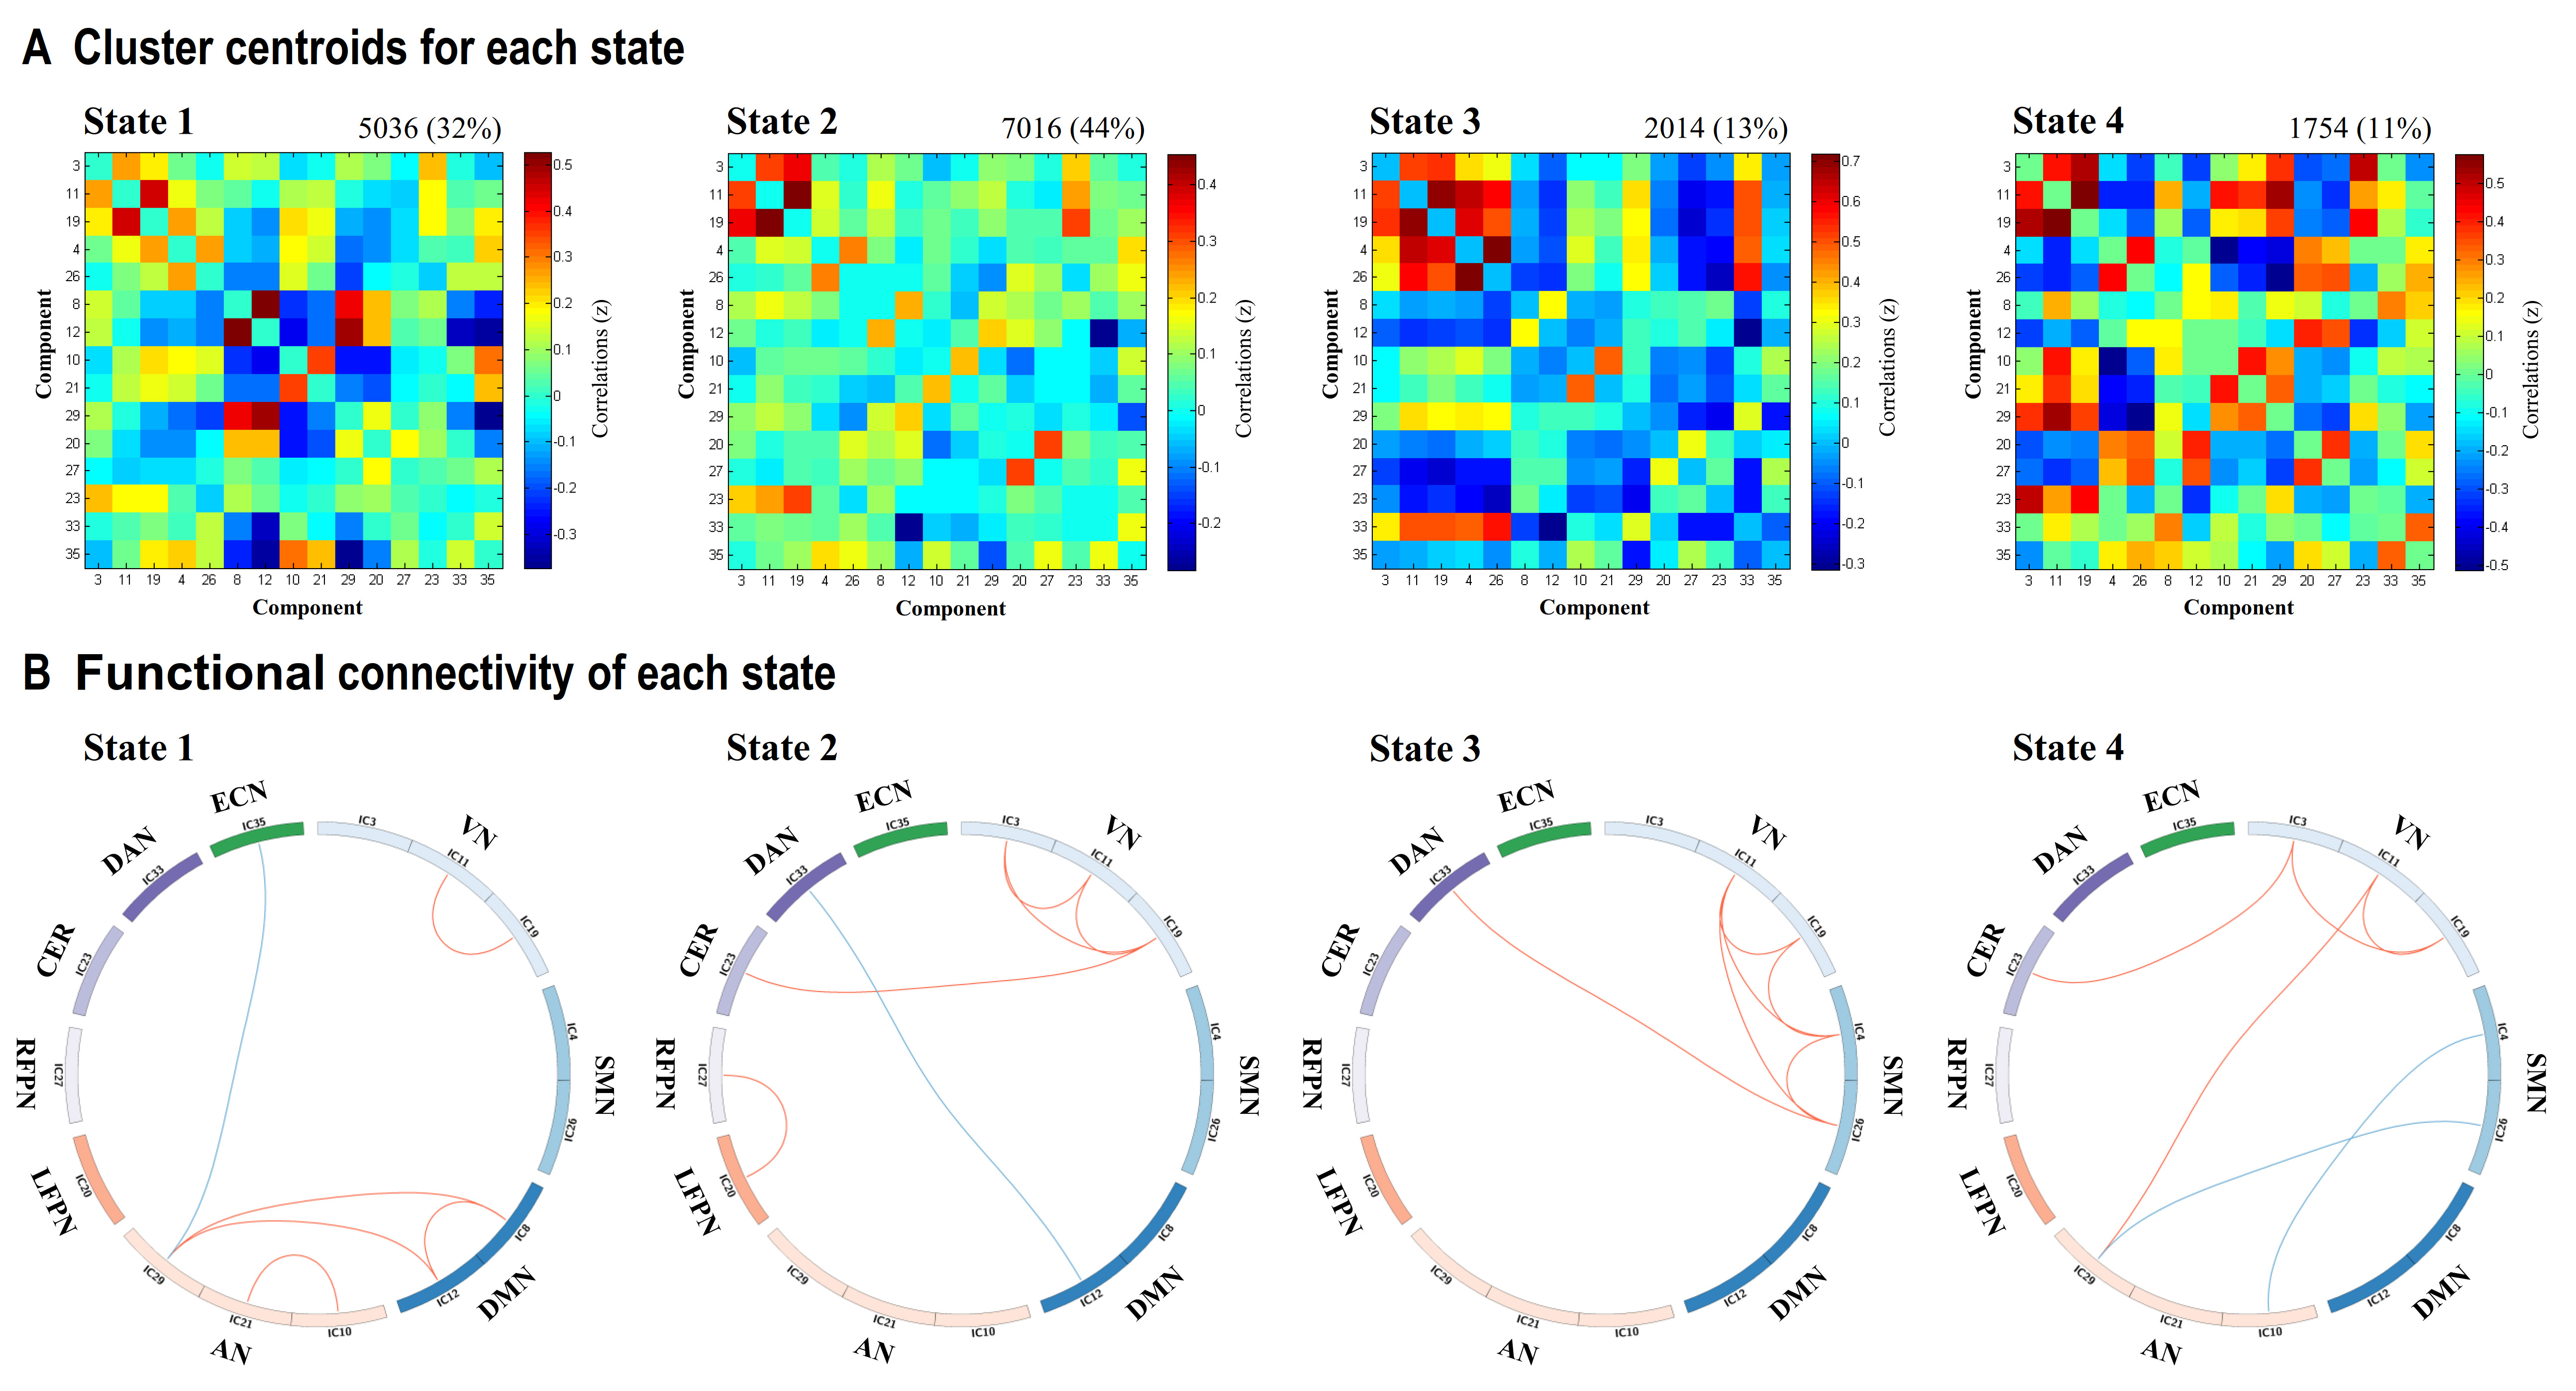
Figure 3. Results of the k-means clustering analysis per
state. A. Cluster centroids for each state. B. The strongest 5% of the
functional connectivity matrix in each state. Red lines represent positive functional connectivity, and
blue lines represent negative functional connectivity. VN = visual network; SMN = sensorimotor network; DMN = default mode network; AN = auditory network;
LFPN = left
frontoparietal network; RFPN = right frontoparietal network; CER = cerebellum;
DAN = dorsal attention network; ECN = executive control network.
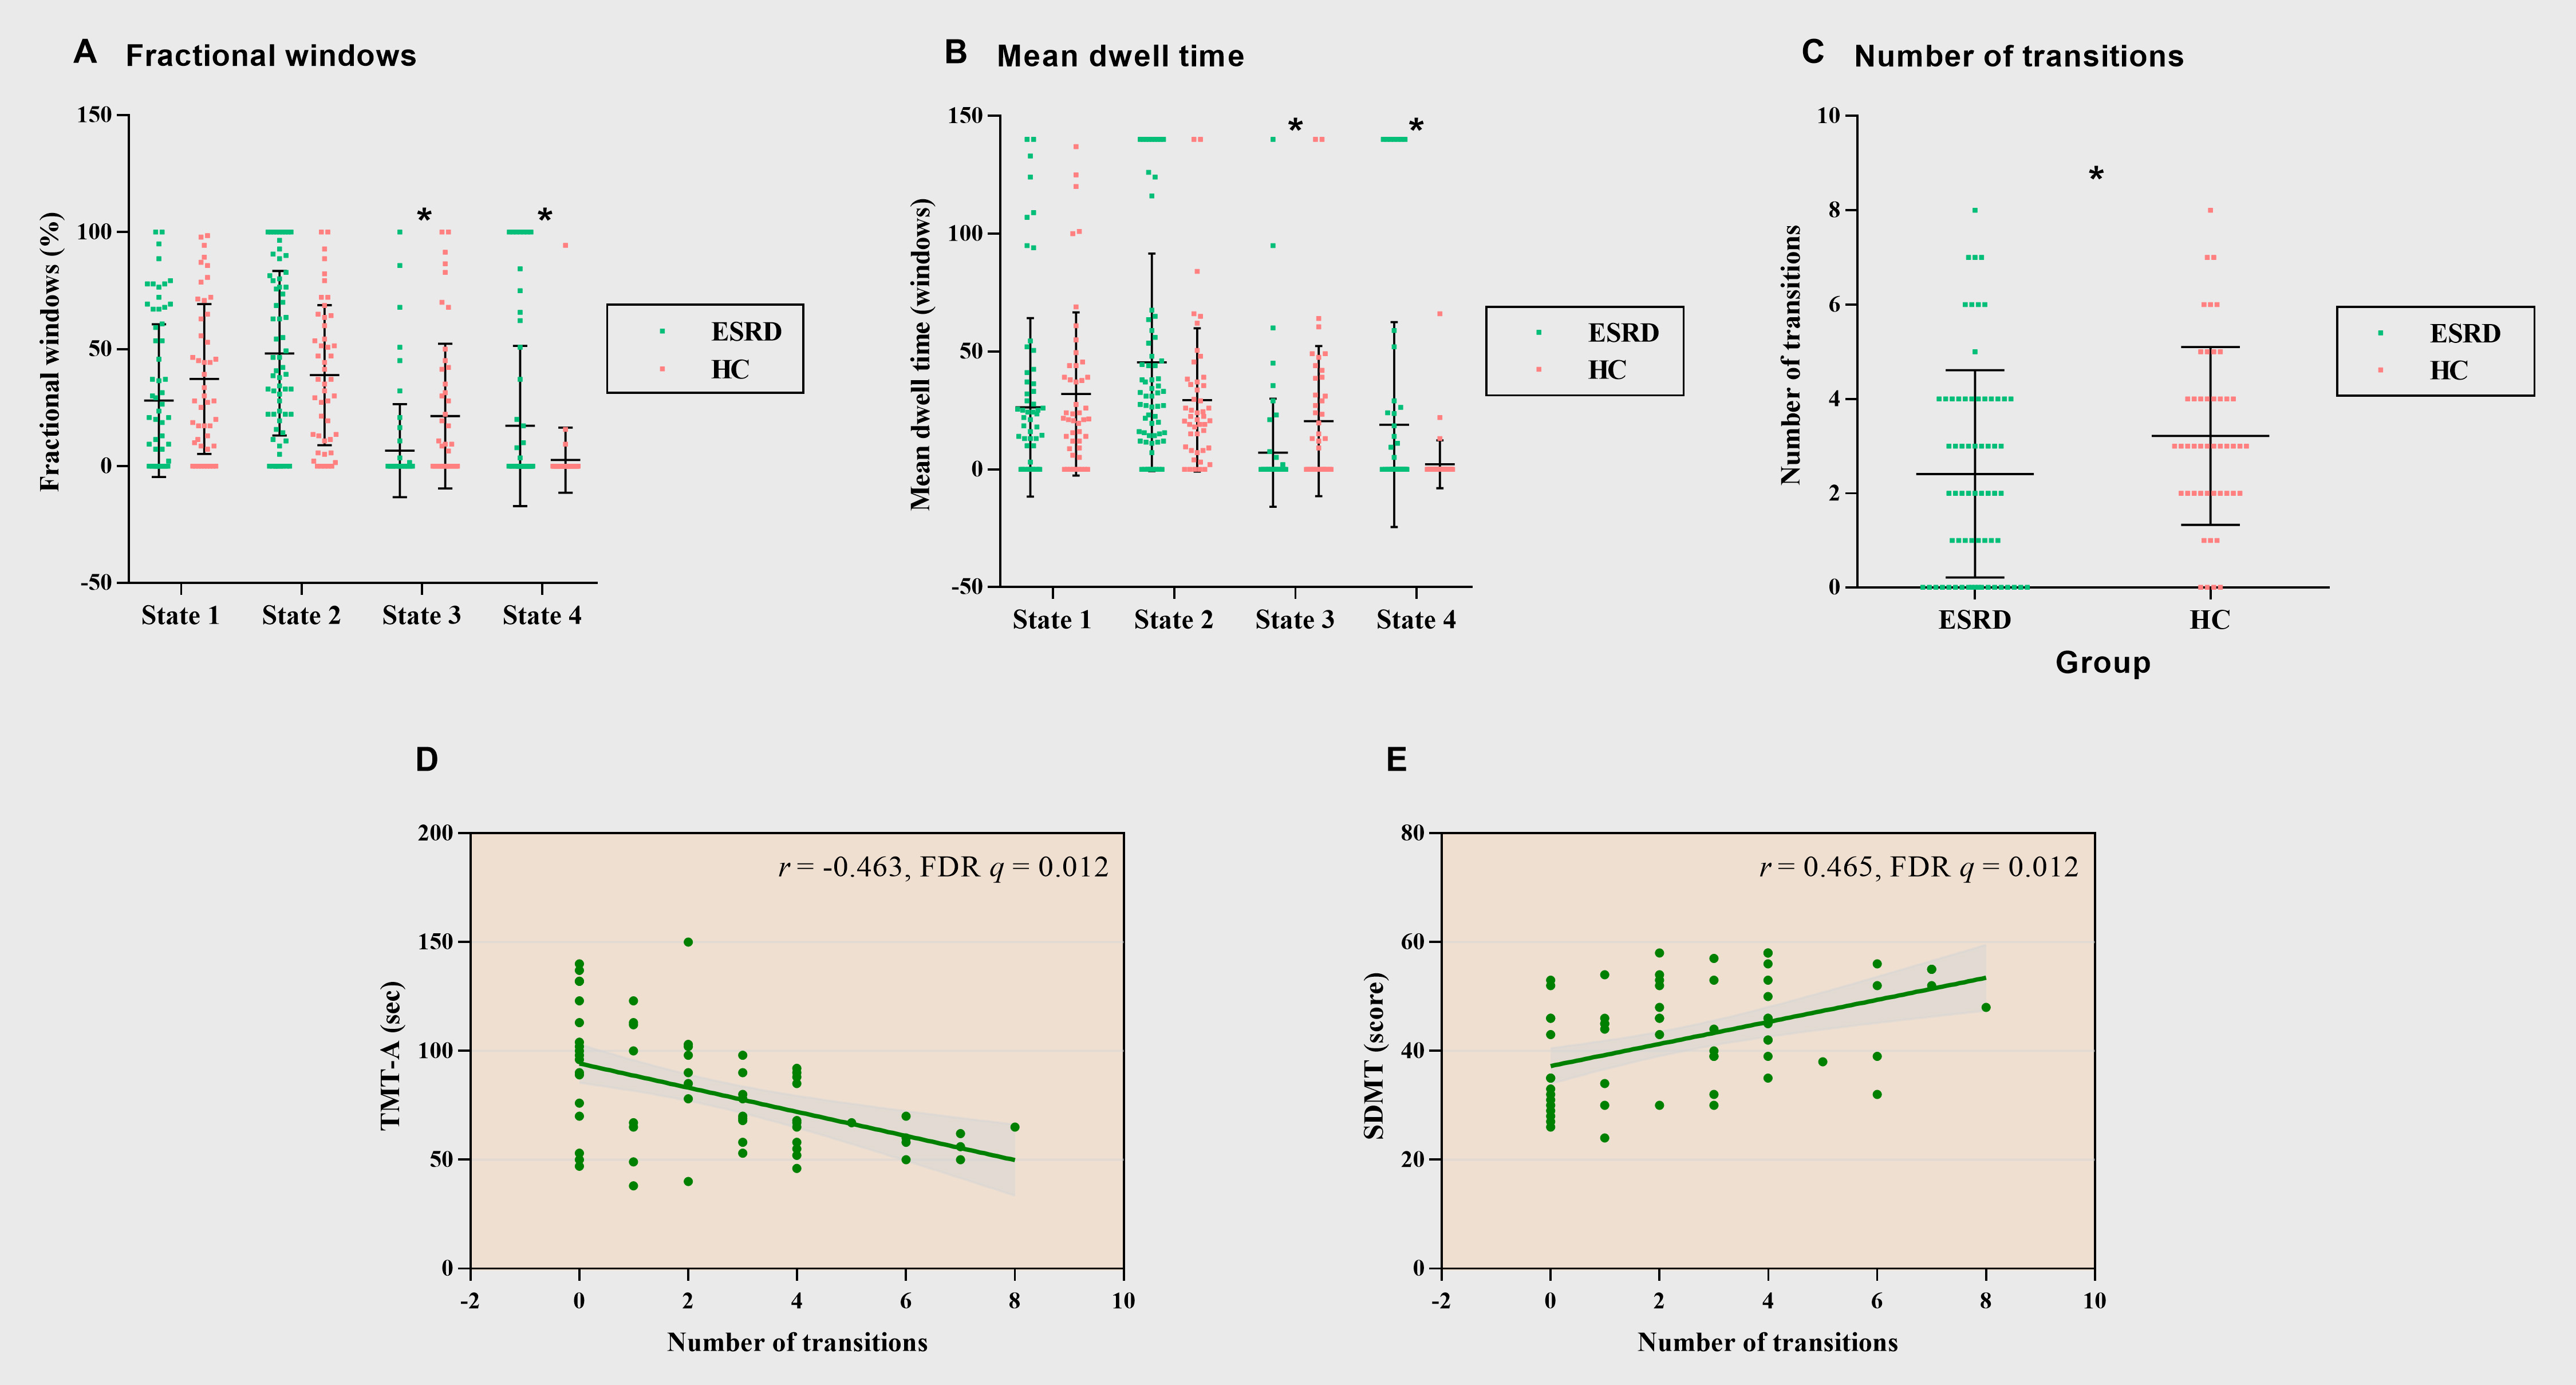
Figure 5. Between-group comparison in temporal
properties of functional connectivity states and the partial correlation
analysis results. Dot plots show individual data points (squares),
averages (transverse lines), and standard deviations (vertical lines) of the
mean fractional windows (A), mean dwell time (B), and total number of
transitions (C). The transverse lines represent averages, and the vertical
lines represent standard deviations. D-E. Partial correlation analysis results. *p < 0.05. TMT-A = Trail
Making Test A; SDMT = Symbol Digit Modalities Test