Yan-Chao Liu1, Bo-Hao Zhang2, De-Sheng Xuan2, Xue-Yuan Wang2, Kai-Yu Wang3, Xin Zhao2, and Xiao-An Zhang2
1Department of Radiology, The Third Affiliated Hospital of Zhengzhou University, Zhengzhou, China, 2Department of Radiology, the Third Affiliated Hospital of Zhengzhou University, Zhengzhou, 450052, China, Zhengzhou, China, 3MR Research China, GE Healthcare, Beijing 100000, PR China, Beijing, China
1Department of Radiology, The Third Affiliated Hospital of Zhengzhou University, Zhengzhou, China, 2Department of Radiology, the Third Affiliated Hospital of Zhengzhou University, Zhengzhou, 450052, China, Zhengzhou, China, 3MR Research China, GE Healthcare, Beijing 100000, PR China, Beijing, China
Multiple MRI quantitative techniques have
confirmed that postnatal brain development is an ongoing maturation process. Fetal brain development is an ongoing
process. In this work, T1Mapping allowed quantitative
assessment of fetal brain development.
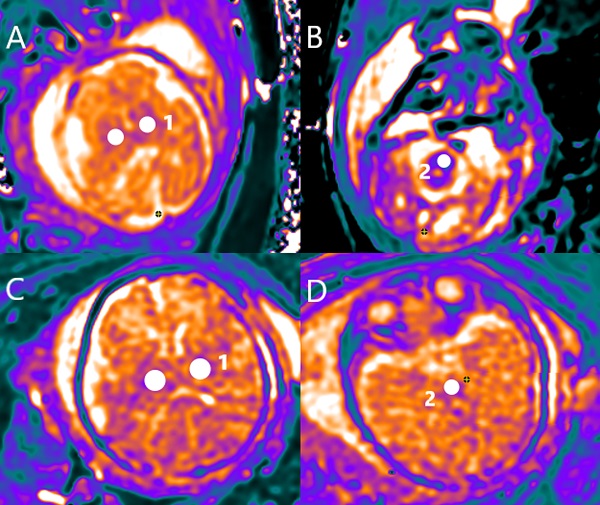
T1Mapping maps in
the fetal brain (A–D). Examples of ROIs for DTI are shown in white color (1–2).
The area of the ROI was adjusted appropriately according to the gestational
week and anatomical structures. Regions of interest: 1,
Thalamus; 2, Corticospinal fibers. A and B are T1Mapping
images of the same fetus; And gestation ages was 28 week. C and D are T1Mapping images of the same
fetus; And gestation ages was 36 week.
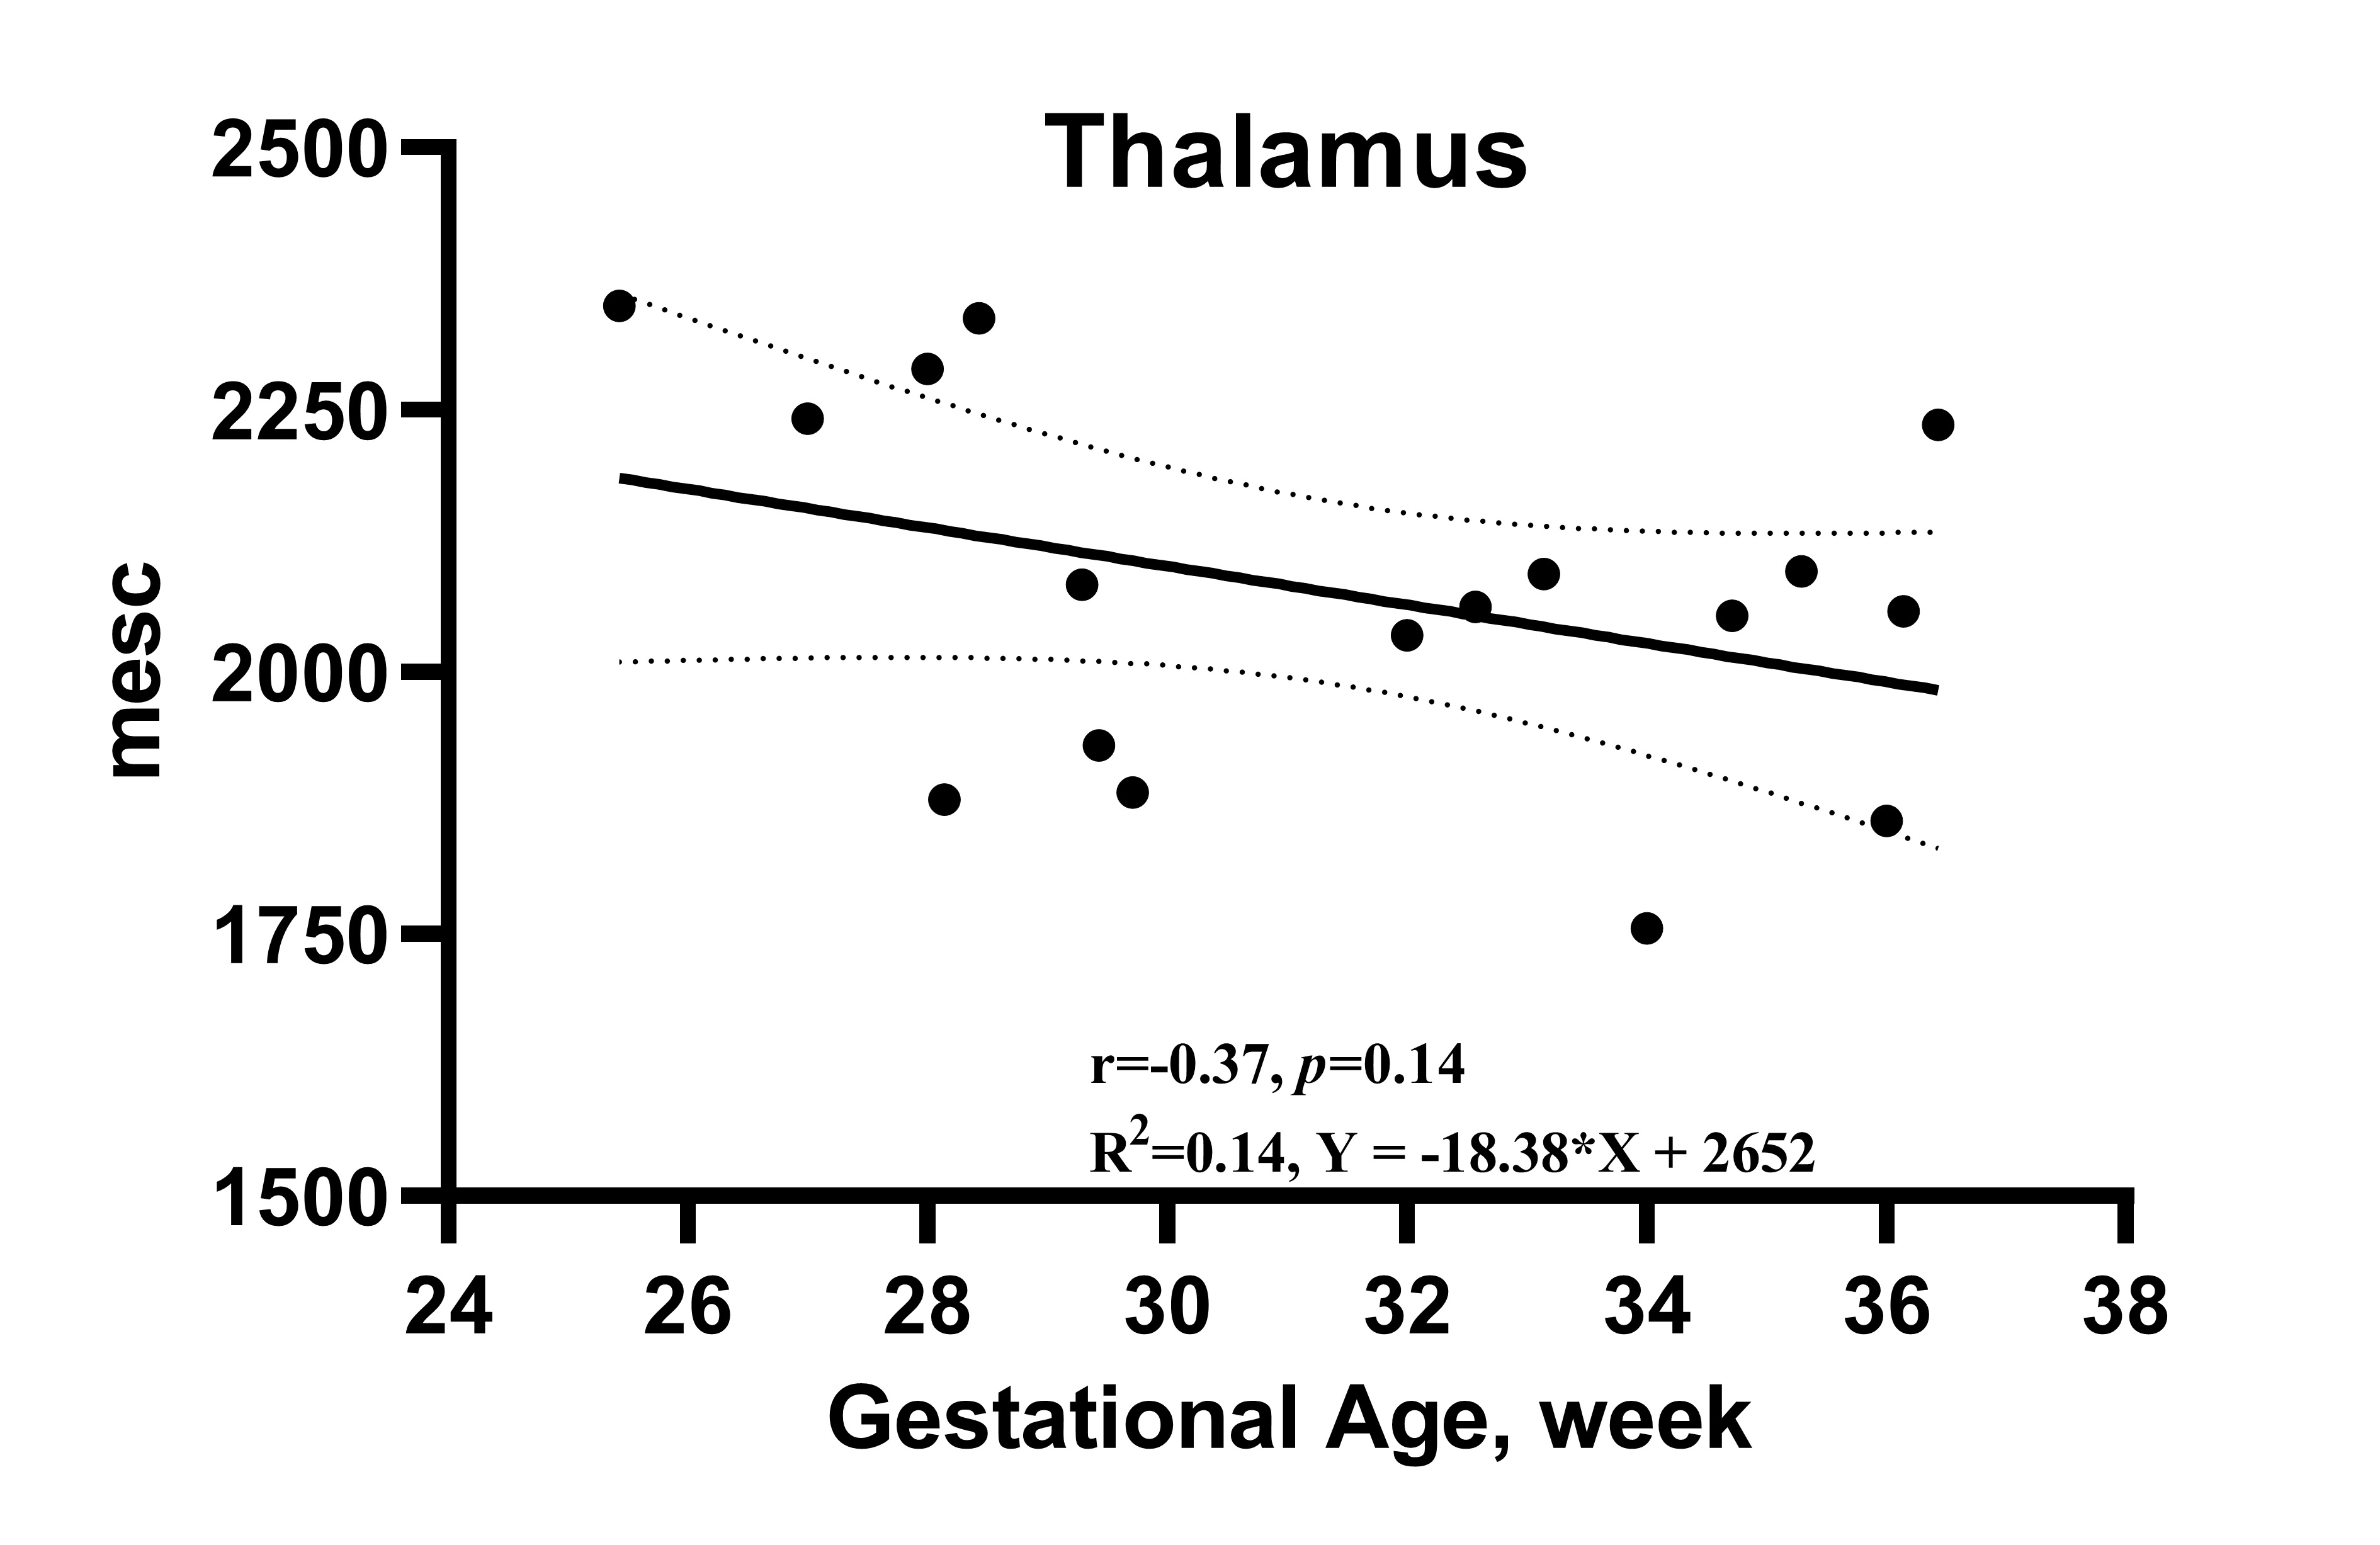
T1 relaxation time trajectories in Thalamus for 17 subjects. T1 had good correlation with gestational age. A regression line is shown along with 95% confidence intervals (dotted lines).