Xiao Liang1, Pan Su2, Steve Roys1, Rao P Gullapalli1, Jerry L Prince3, and Jiachen Zhuo1
1Department of Diagnostic Radiology and Nuclear Medicine, University of Maryland School of Medicine, Baltimore, MD, United States, 2Siemens Medical Solutions USA Inc, Malvern, PA, United States, 3Department of Electrical and Computer Engineering, Johns Hopkins University, Baltimore, MD, United States
1Department of Diagnostic Radiology and Nuclear Medicine, University of Maryland School of Medicine, Baltimore, MD, United States, 2Siemens Medical Solutions USA Inc, Malvern, PA, United States, 3Department of Electrical and Computer Engineering, Johns Hopkins University, Baltimore, MD, United States
We developed a more robust phase image-based motion detection method (APITA-MDD) that automatically generates ROI for motion detection and detects motion based on a robust metric . The APITA-MDD correctly identified motion at edge slices and motion caused by head rotation and leg crossing.
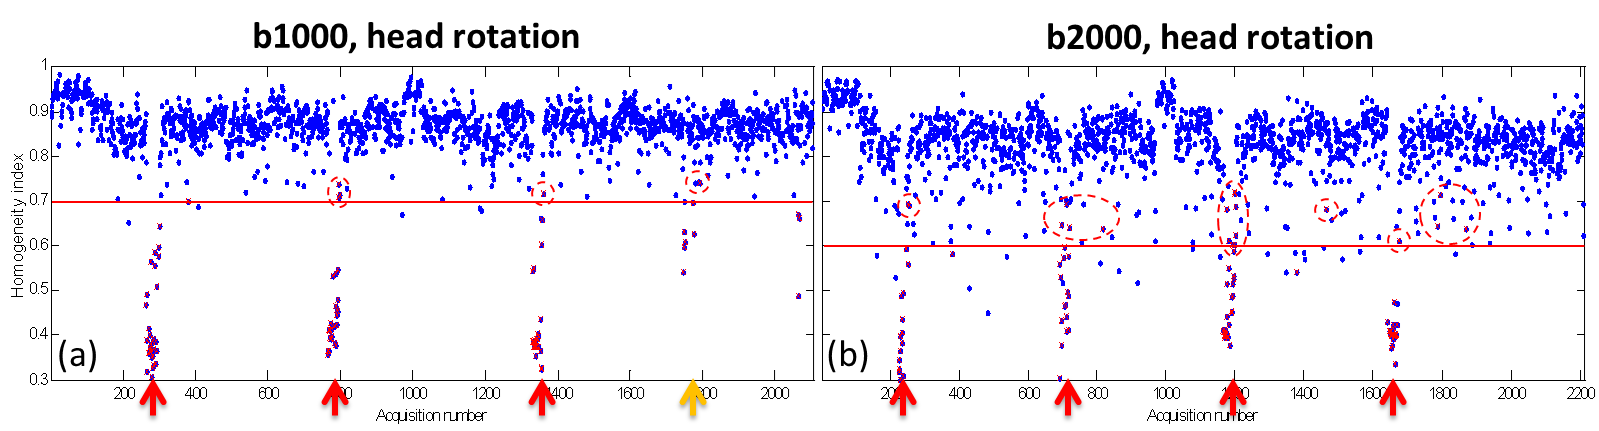
Figure 3. Scattered plots of HHI values for all slices for
an example b1000 (a) and b2000 (b) cases. Motion detected by PITA-MDD are all
dots fall below the HHI threshold, defined as 0.7 for b1000 and 0.6 for b2000
dMRI (red lines). Motion detected by APITA-MDD are denoted in red. Notice
slices missed by PITA-MDD but detected with adaptive thresholding in APITA-MDD
(circle). Arrows indicate time when motion instruction was given.
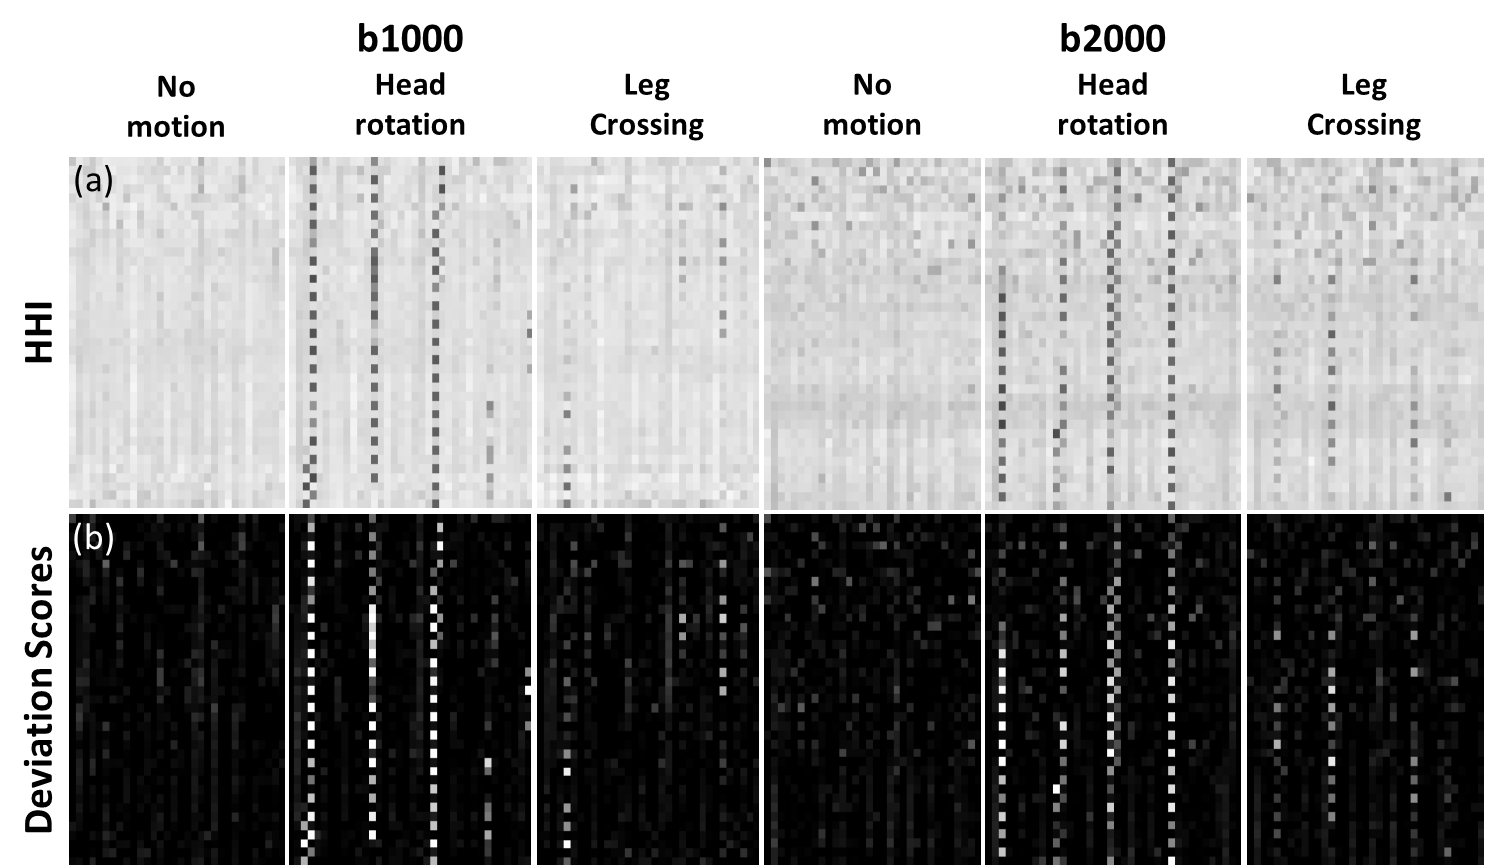
Figure 4. Heat maps of HHI (a) and the deviation score M (b) for
representative b1000 and b2000 acquisitions with no motion, head rotation, and
leg crossing motions. In each map, the horizontal axis represents volume index,
and vertical axis represent slices index. Range for HHI is [0,1]. Range for
deviation score is from 0 to maximum value 25.