1Peking University First Hospital, Beijing, China, 2MR Collaboration, Siemens Healthcare Ltd China, Beijing, China, 3MR Application Development, Siemens Healthcare GmbH, Erlangen, Germany
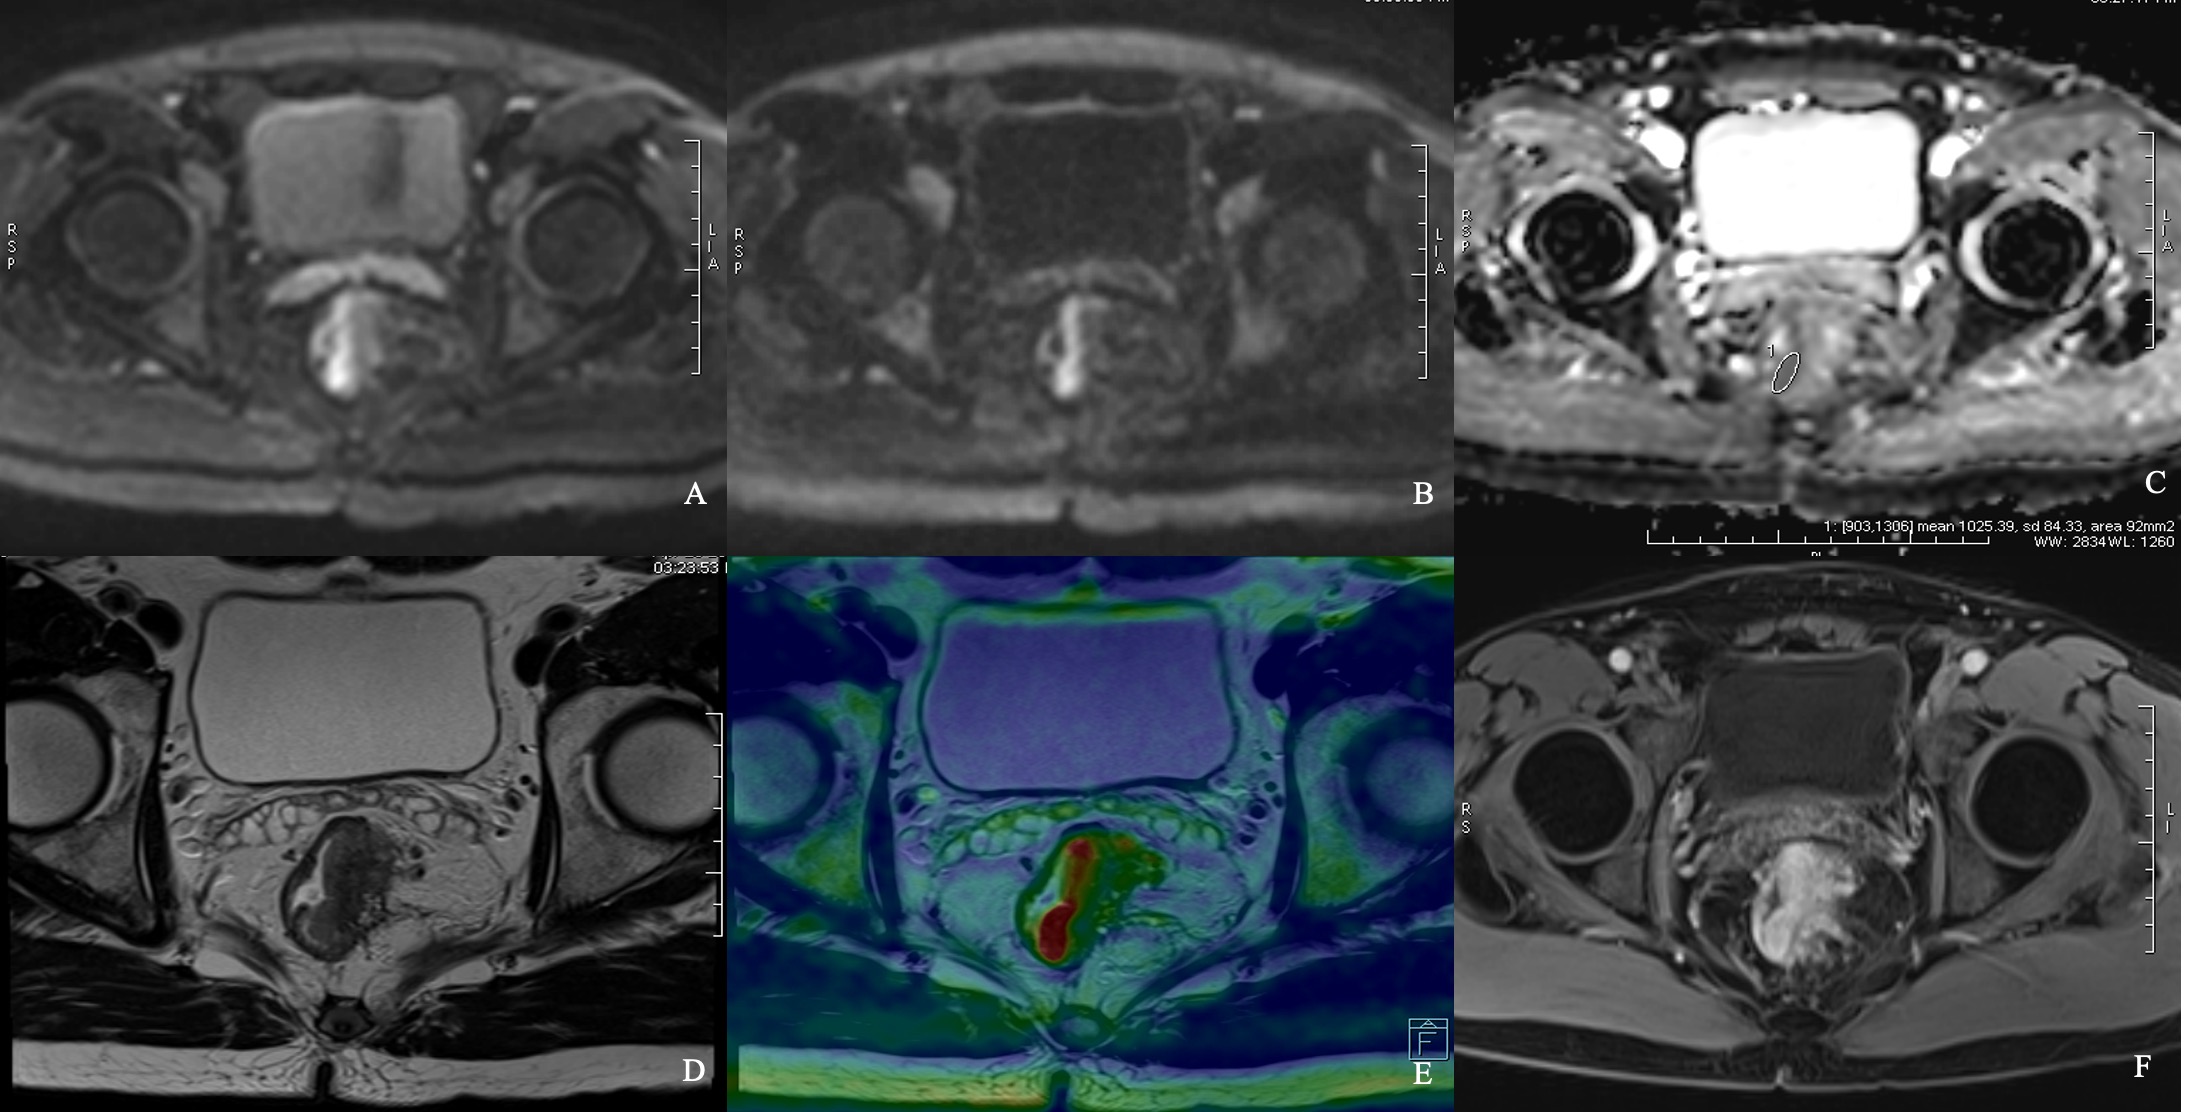
Figure 4 iShim DWI for patient with primary rectal cancer of Grade 1
DW images of b800 (A), b1600 (B), ADC map (C), T2WI (D), infusion images of both T2WI and DWI (E) and dynamic T1WI (F) showed the same location of lesion. Average ADC value measured was 1025.39 mm2/s (C).
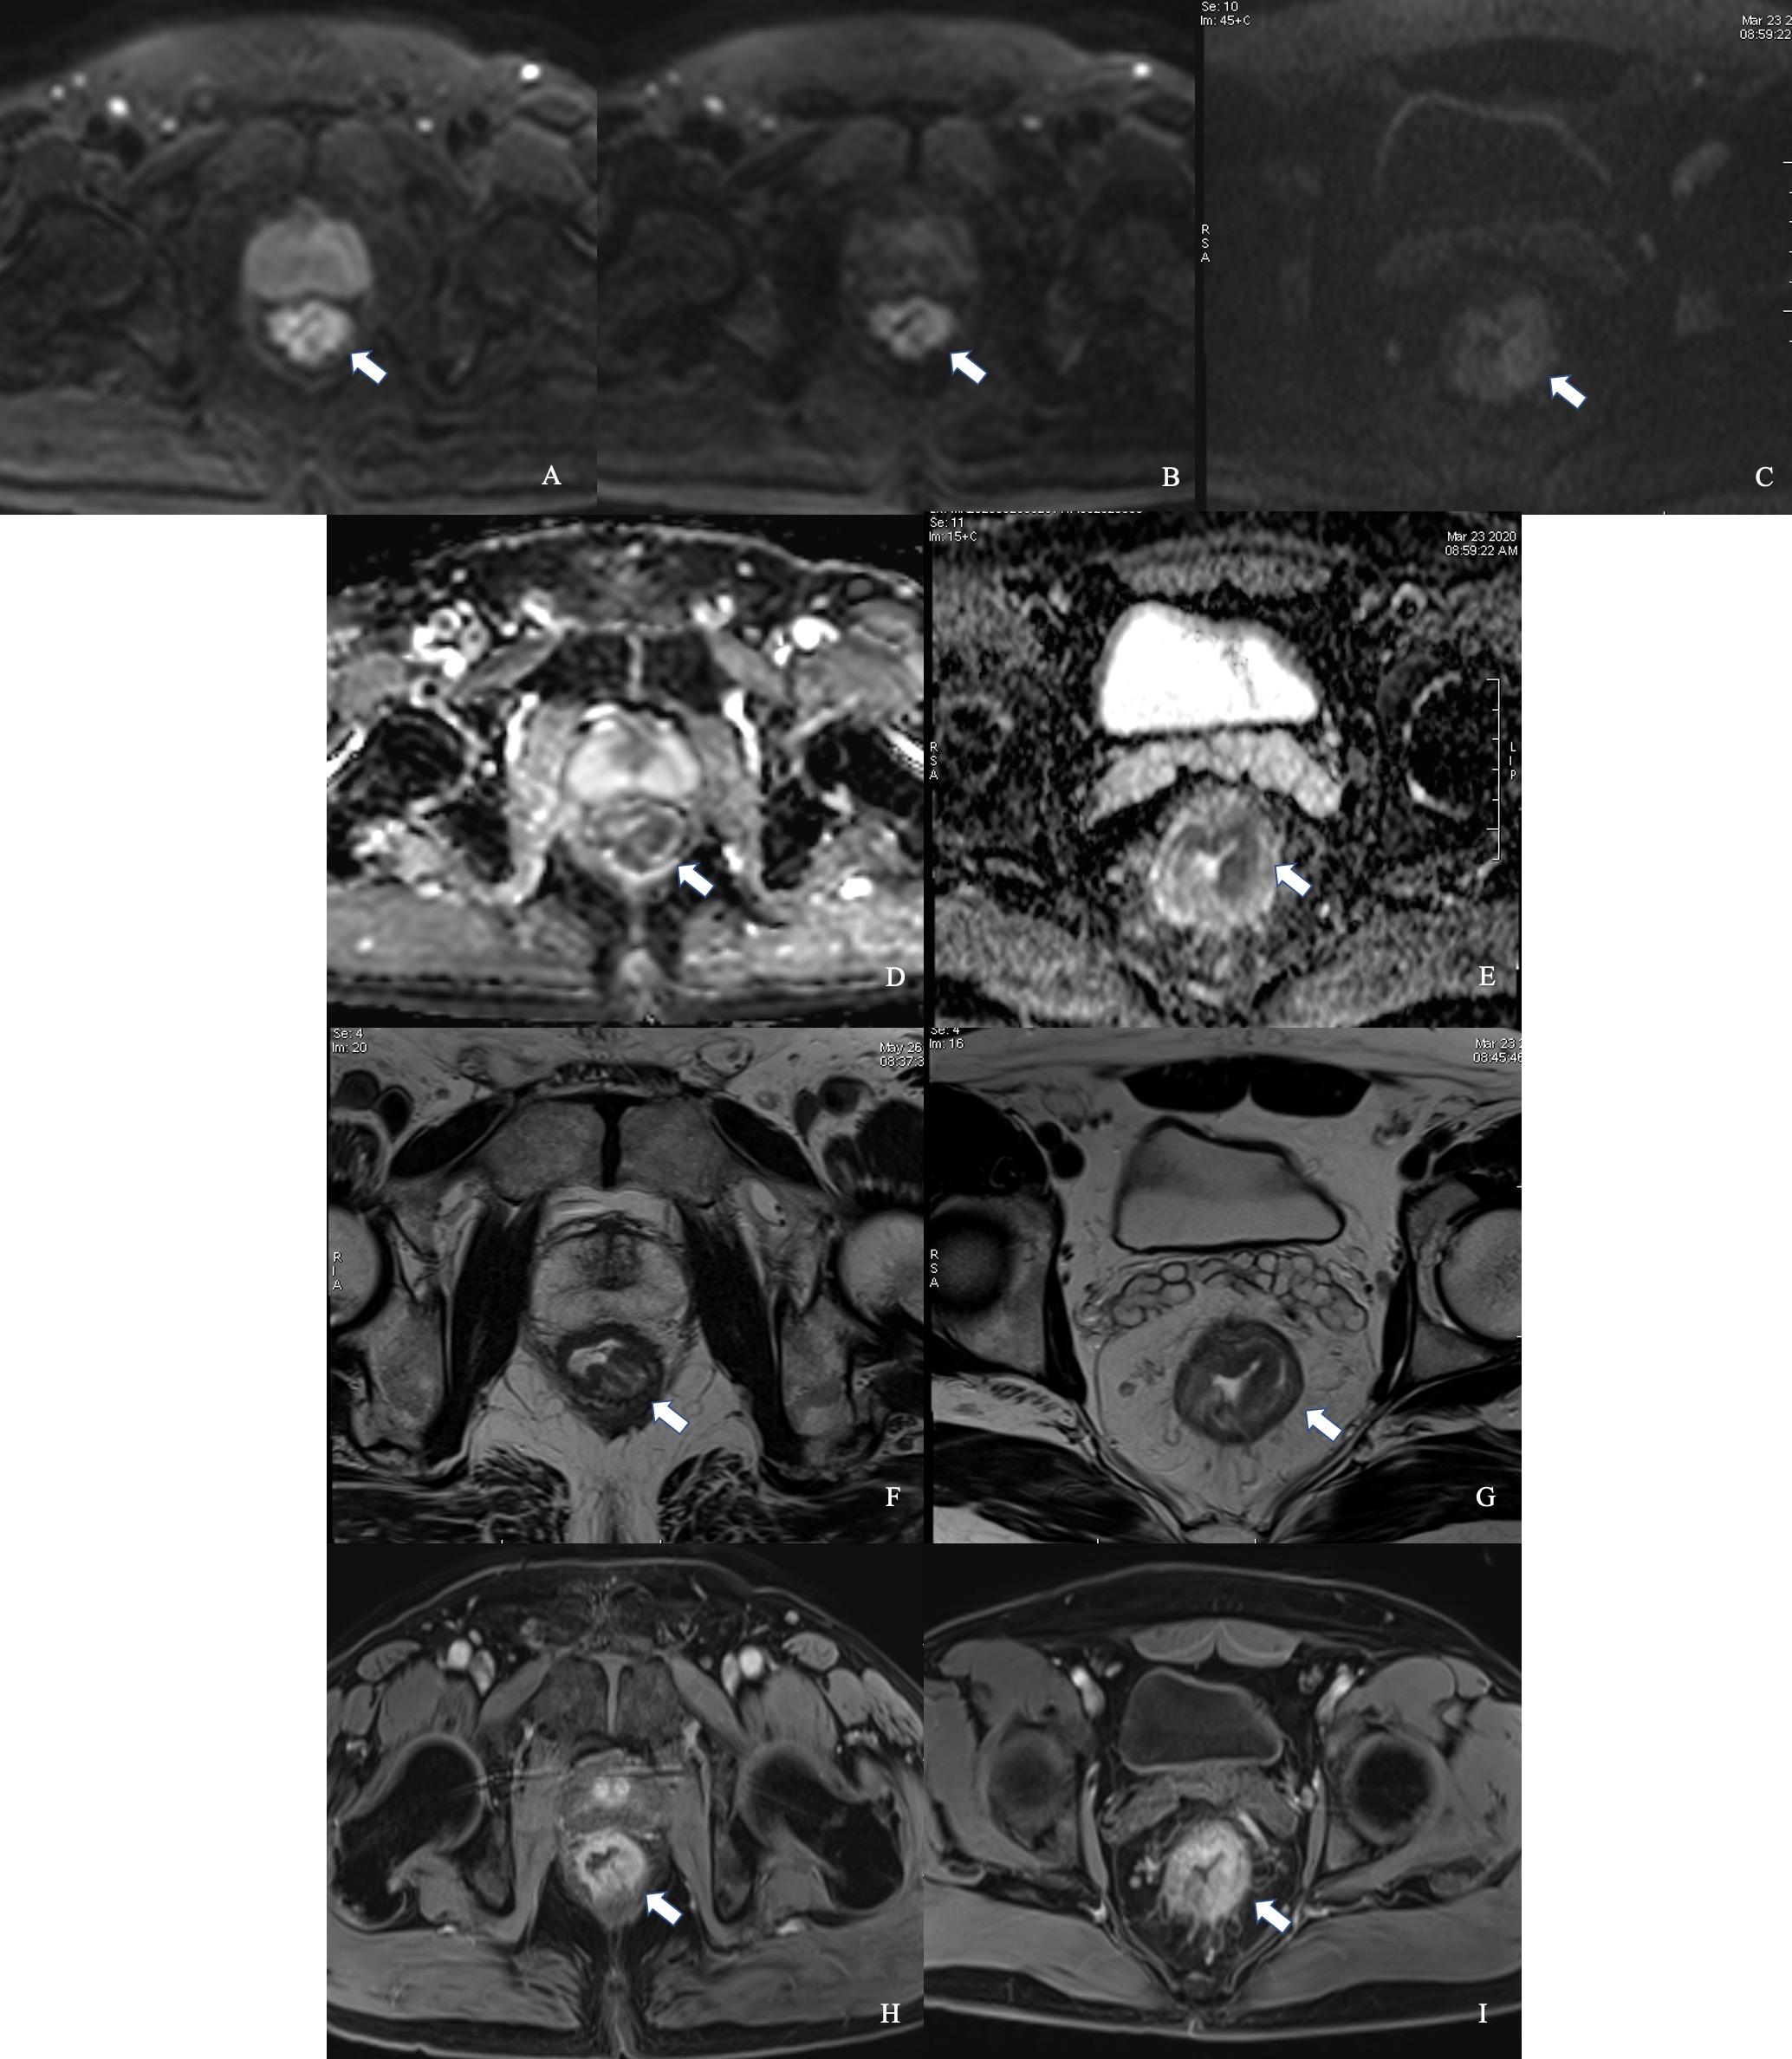
Figure 2 Comparison between iShim- and SS-EPI-DWI in patients after CRT.
Images on the left side were on the same location in patients with iShim-DWI. Images on the right side were on the same location in patients with SS-EPI-DWI. iShim-DWI of b800 (A) and b1600 (B) showed higher SNR and CNR with lower signal noise compared with SS-EPI-DWI of b1000 (C). ADC map (E) of iShim-DWI showed better image quality compared with ADC map (F) of SS-EPI-DWI. T2W images (F and G) and dynamic T1W images (H and I) showed the same location of lesion (arrows) for iShim- and SS-EPI- cohort, respectively.