1Neurobiology Research Unit, Dept. of Neurology, Copenhagen University Hospital Rigshospitalet, Copenhagen, Denmark, 2Danish Research Centre for Magnetic Resonance, Centre for Functional and Diagnostic Imaging and Research, Hvidovre, Denmark, 3Section for Magnetic Resonance, DTU Health Tech, Technical University of Denmark, Kgs. Lyngby, Denmark, 4Faculty of Health and Medical Sciences, University of Copenhagen, Copenhagen, Denmark, 5Philips Healhtcare, Copenhagen, Denmark
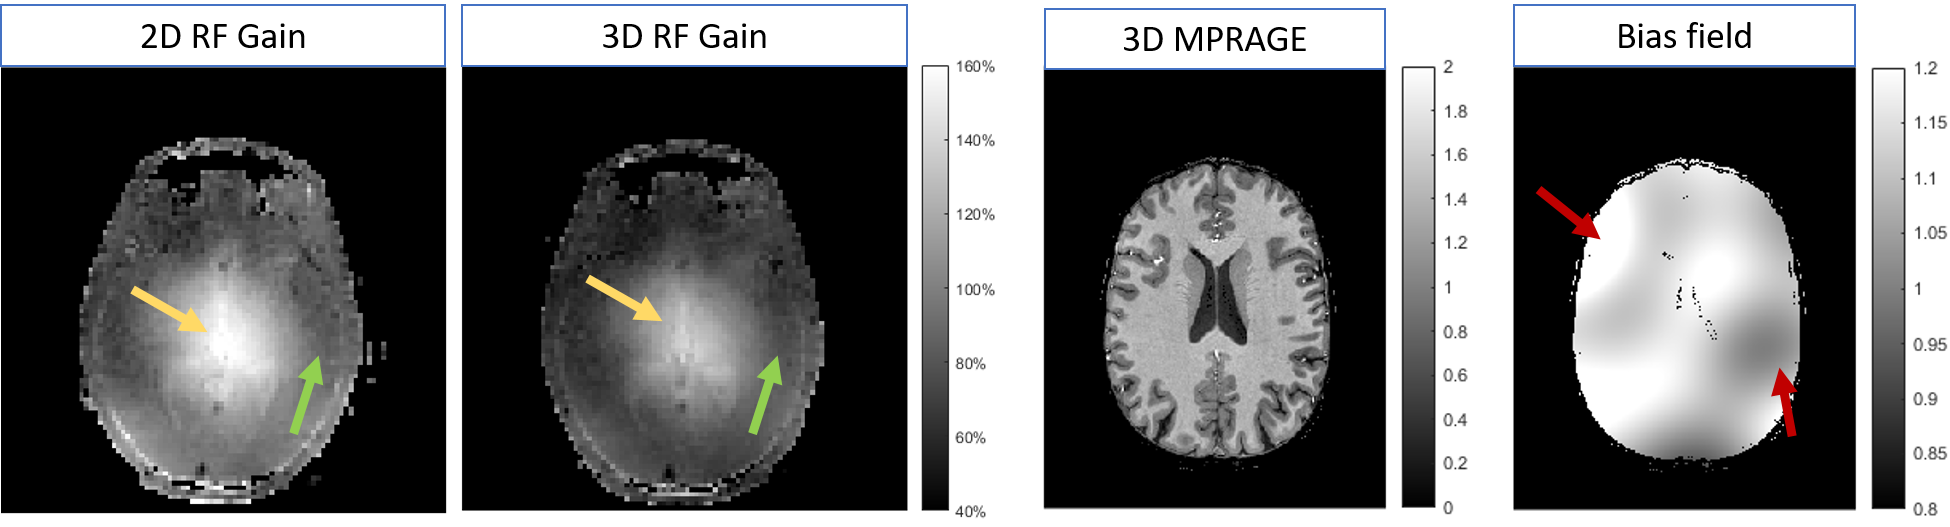
Figure 1:
Two images to the left: Examples of B1+ maps after 2D and 3D RF gain optimization from the same subject. The 2D gain optimization for this subject caused B1+ of 160% in the center of the brain. The 3D optimization caused B1+ of 140% (yellow arrows). The green arrows indicate lateral area typically presenting B1-induced inhomogeneity whose severity vary particularly with head size and placement of dielectric pads.
Two right images: Example of a bias field corrected 3D MPRAGE image and the computed bias field. The red arrows demonstrates 40% MPRAGE magnitude variations.
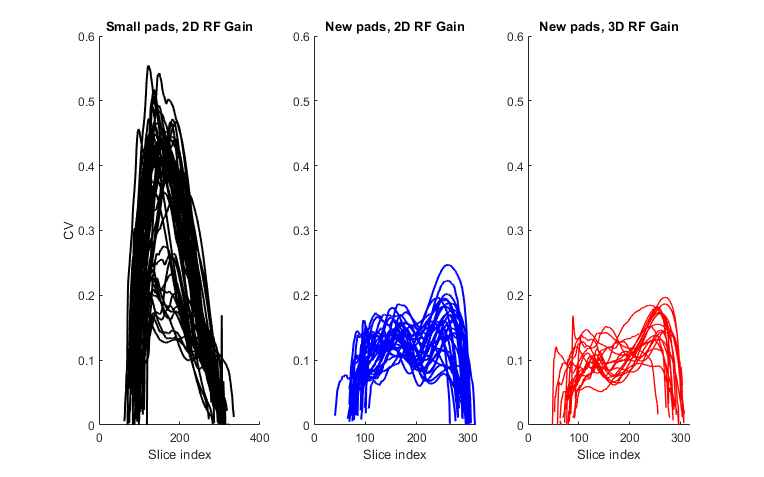
Figure 2:
Plots showing variability of CV across the slices in the individual brainmasks for group 1 (black, n=48), group 2 (blue, n=29) and group 3 (red, n=18). The slice-indexing is feet-head, i.e. high numbers corresponds to the top of the head.