Sebastian Mueller1, Kai Herz1, Klaus Scheffler1,2, and Moritz Zaiss1,3
1High-field Magnetic Resonance Center, Max Planck Institute for Biological Cybernetics, Tuebingen, Germany, 2Department of Biomedical Magnetic Resonance, Eberhard Karls University Tuebingen, Tuebingen, Germany, 3Department of Neuroradiology, University Hospital Erlangen, Erlangen, Germany
1High-field Magnetic Resonance Center, Max Planck Institute for Biological Cybernetics, Tuebingen, Germany, 2Department of Biomedical Magnetic Resonance, Eberhard Karls University Tuebingen, Tuebingen, Germany, 3Department of Neuroradiology, University Hospital Erlangen, Erlangen, Germany
The proposed approach allows straightforward
implementation of CEST MRI on Bruker scanners without the need of sequence
programming in C. Pre-saturation is defined in open source pulseq-files which
allows direct transfer to clinical devices or usage for simulations.
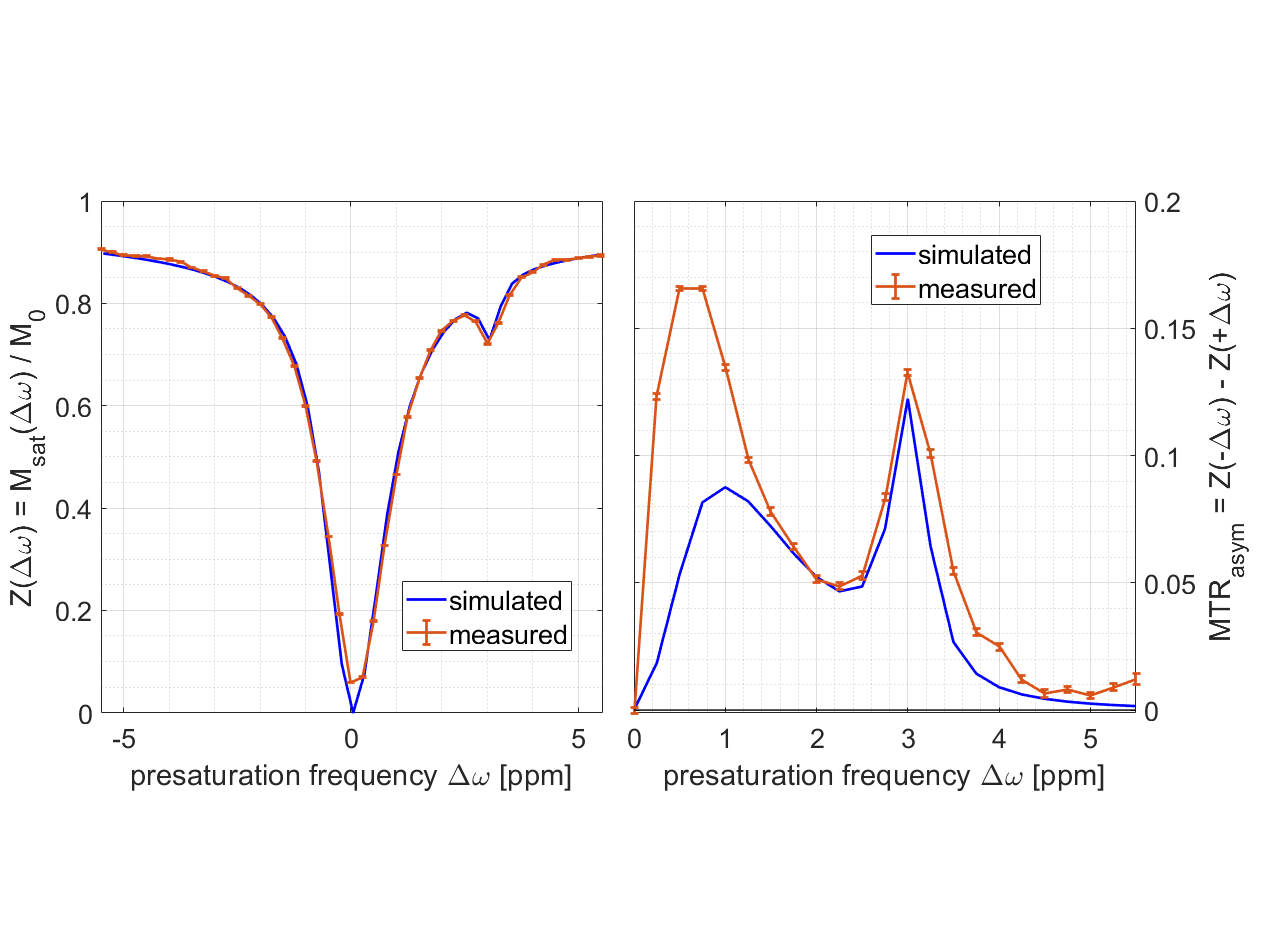
Figure 2:
Data measured (spatial mean and SD) at
B0 = 14T and simulations (same pulseq-file). CEST pools included
water (T1=1735ms, T2=18ms, f=100%), ssMT (T1=1000ms,
T2=0.01ms, dω=0ppm, kex=23Hz, f=5%), L-arginine (T1=1000ms,
T2=5ms, dω=3ppm, f=2.25%) and agar-agar (10) (T1=1000ms, T2=50ms,
dω=1.6ppm, kex=6500Hz, f=1%). Details on pre-saturation and simulation source code: https://pulseq-cest.github.io/
file “APTw_3T_002”; modifications: dω list and B0. Larger deviations in
MTR assymetry at <= 1.5 ppm are most likely due to residual B0
variation in the measured data.
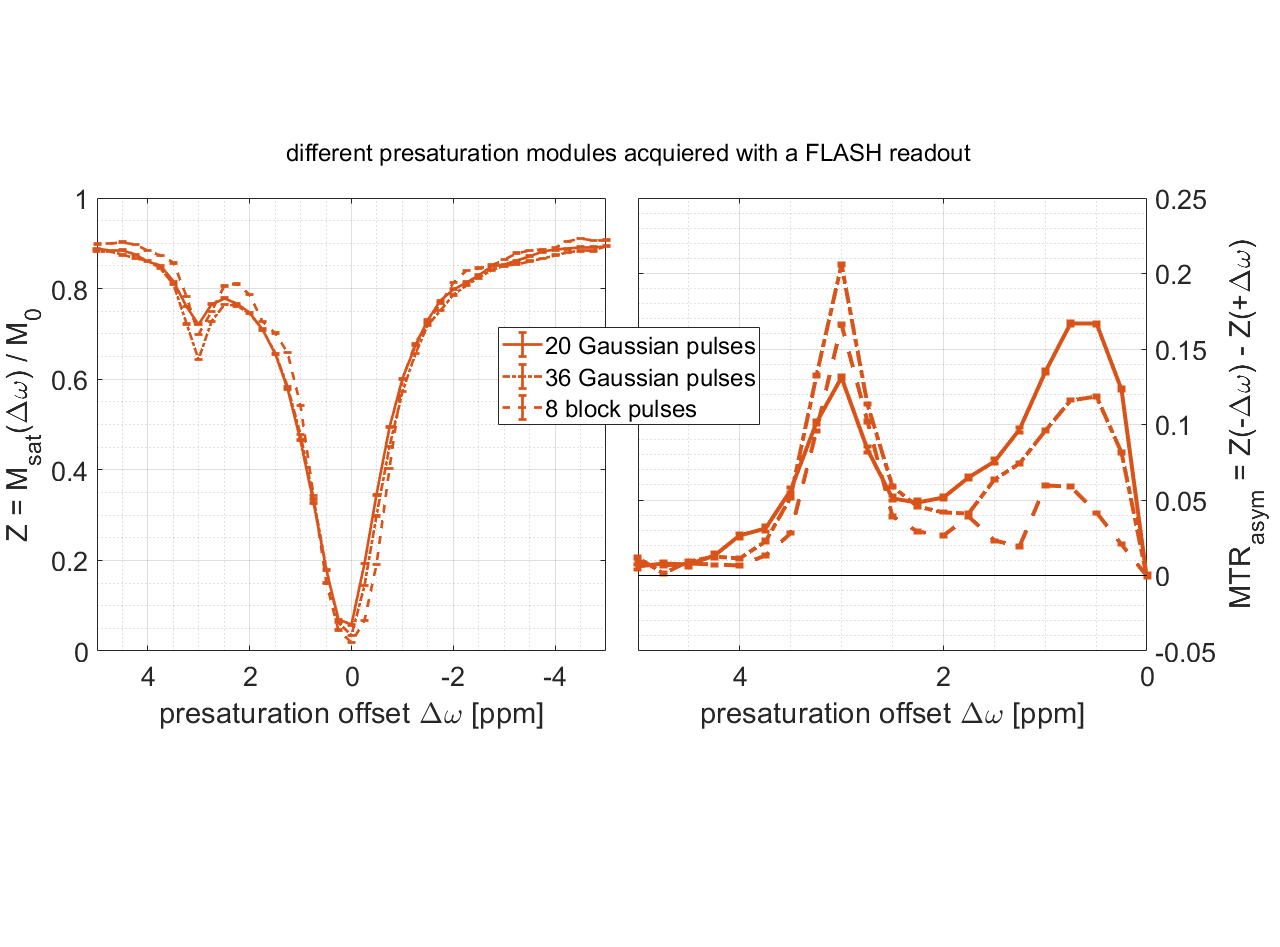
Figure 4: (left)
ROI averaged (mean ± SD) Z-spectra
acquired for different CEST pres-aturation modules using Bruker’s FLASH readout. (right) MTR asymmetry.