Phillip Zhe Sun1
1Department of Radiology and Imaging Sciences, Emory University, Atlanta, GA, United States
1Department of Radiology and Imaging Sciences, Emory University, Atlanta, GA, United States
The QUASS CEST analysis accounts
for the effect of finite Ts and Td and improves the accuracy of CEST MRI
quantification. Both simulation and CEST MRI experiments confirmed that the
QUASS solution enabled robust quantification of ksw and
fr, superior over the conventional apparent CEST MRI.
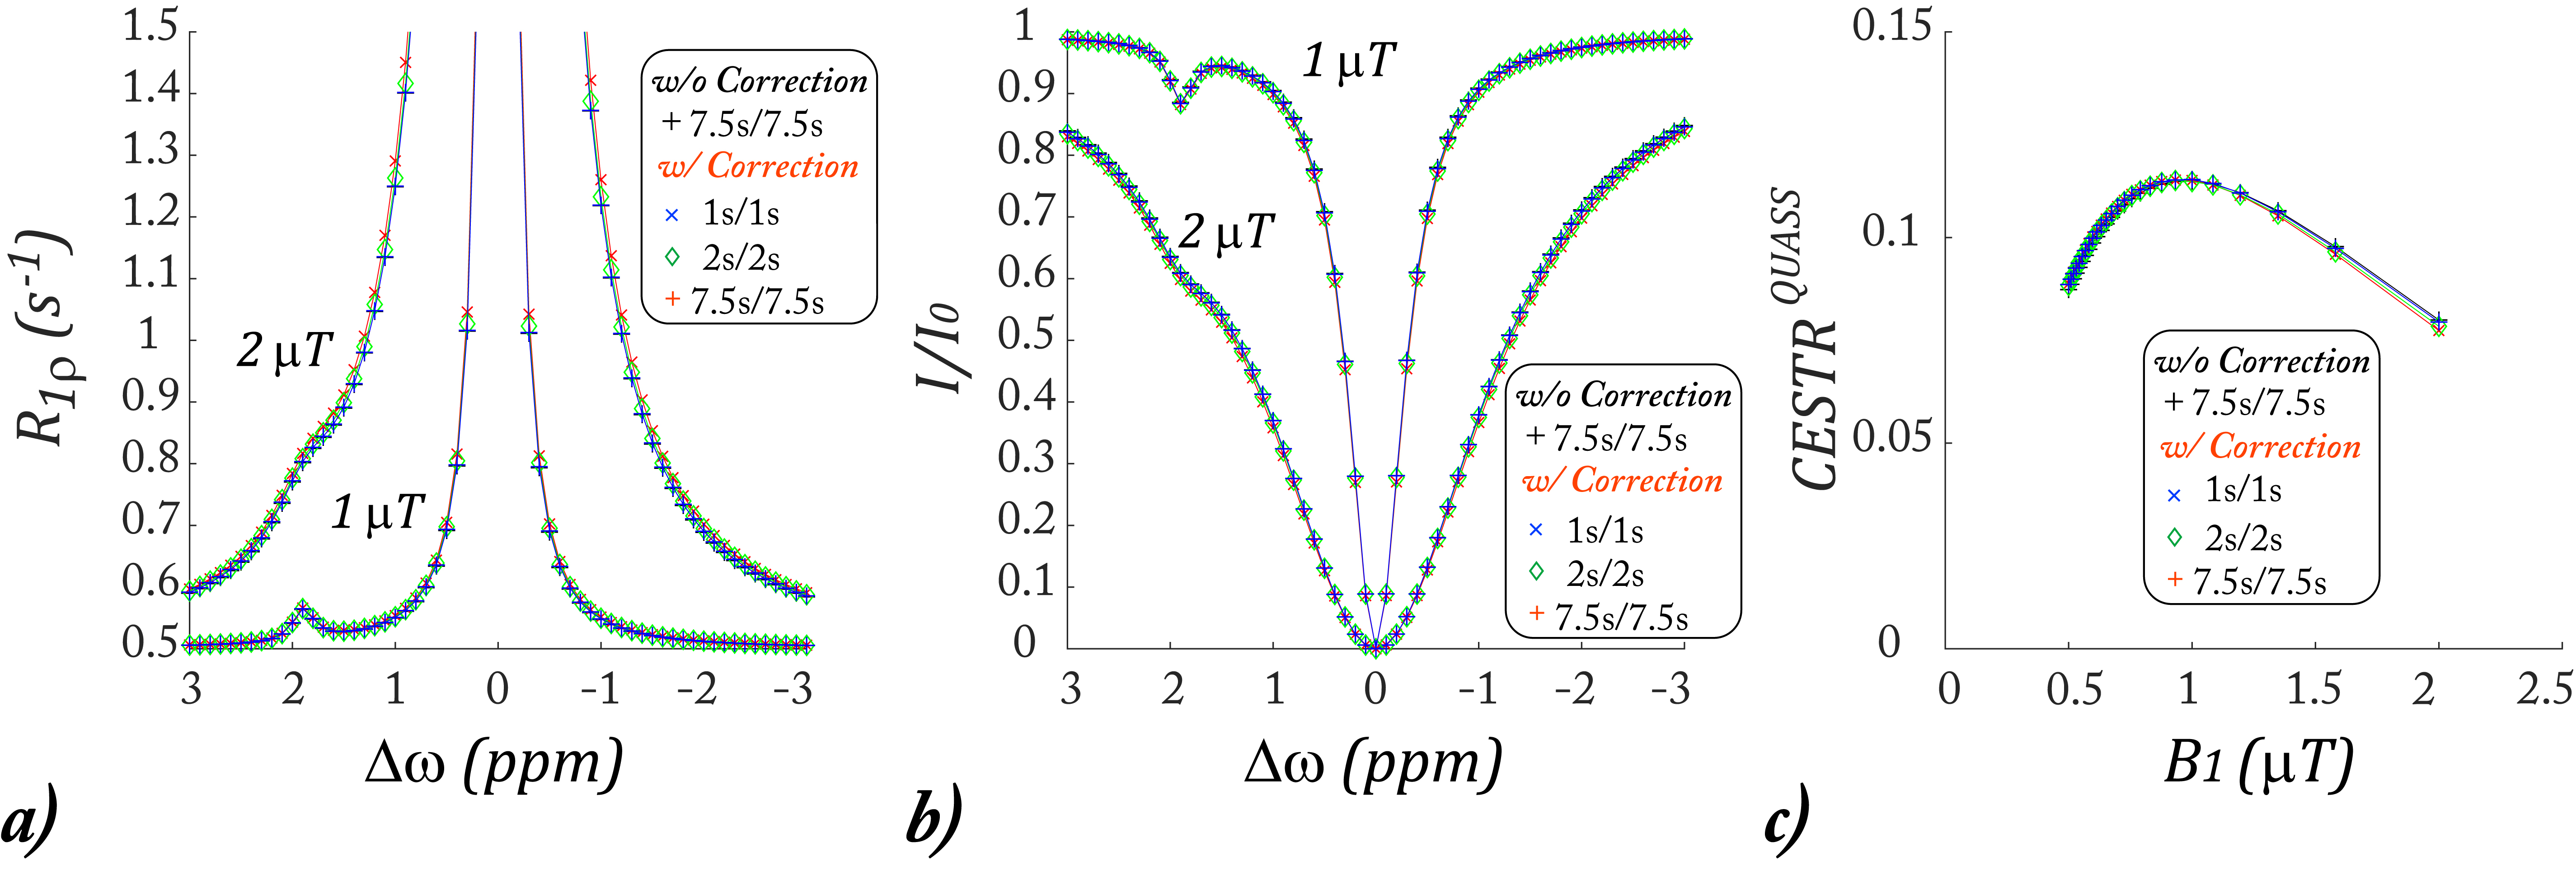
Fig. 2., Simulation of the proposed QUASS CEST MRI. a) R1rho determined from
the QUASS solution for three representative sets of Td and Ts (i.e., 1s/1s
(cross markers), 2s/2s (diamond markers), and 7.5s/7.5s (plus markers) and that
calculated under long Td and Ts (7.5s/7.5s, black plus markers) for B1
levels of 1 and 2 µT. b) The QUASS Z-spectra
under the three representative sets of Td and Ts and two B1 levels
of 1 and 2 µT. c) The QUASS CEST effect at 1.9 ppm as a function of B1
level for three sets of Ts and Td times, being 1s/1s, 2s/2s, and 7.5s/7.5s.
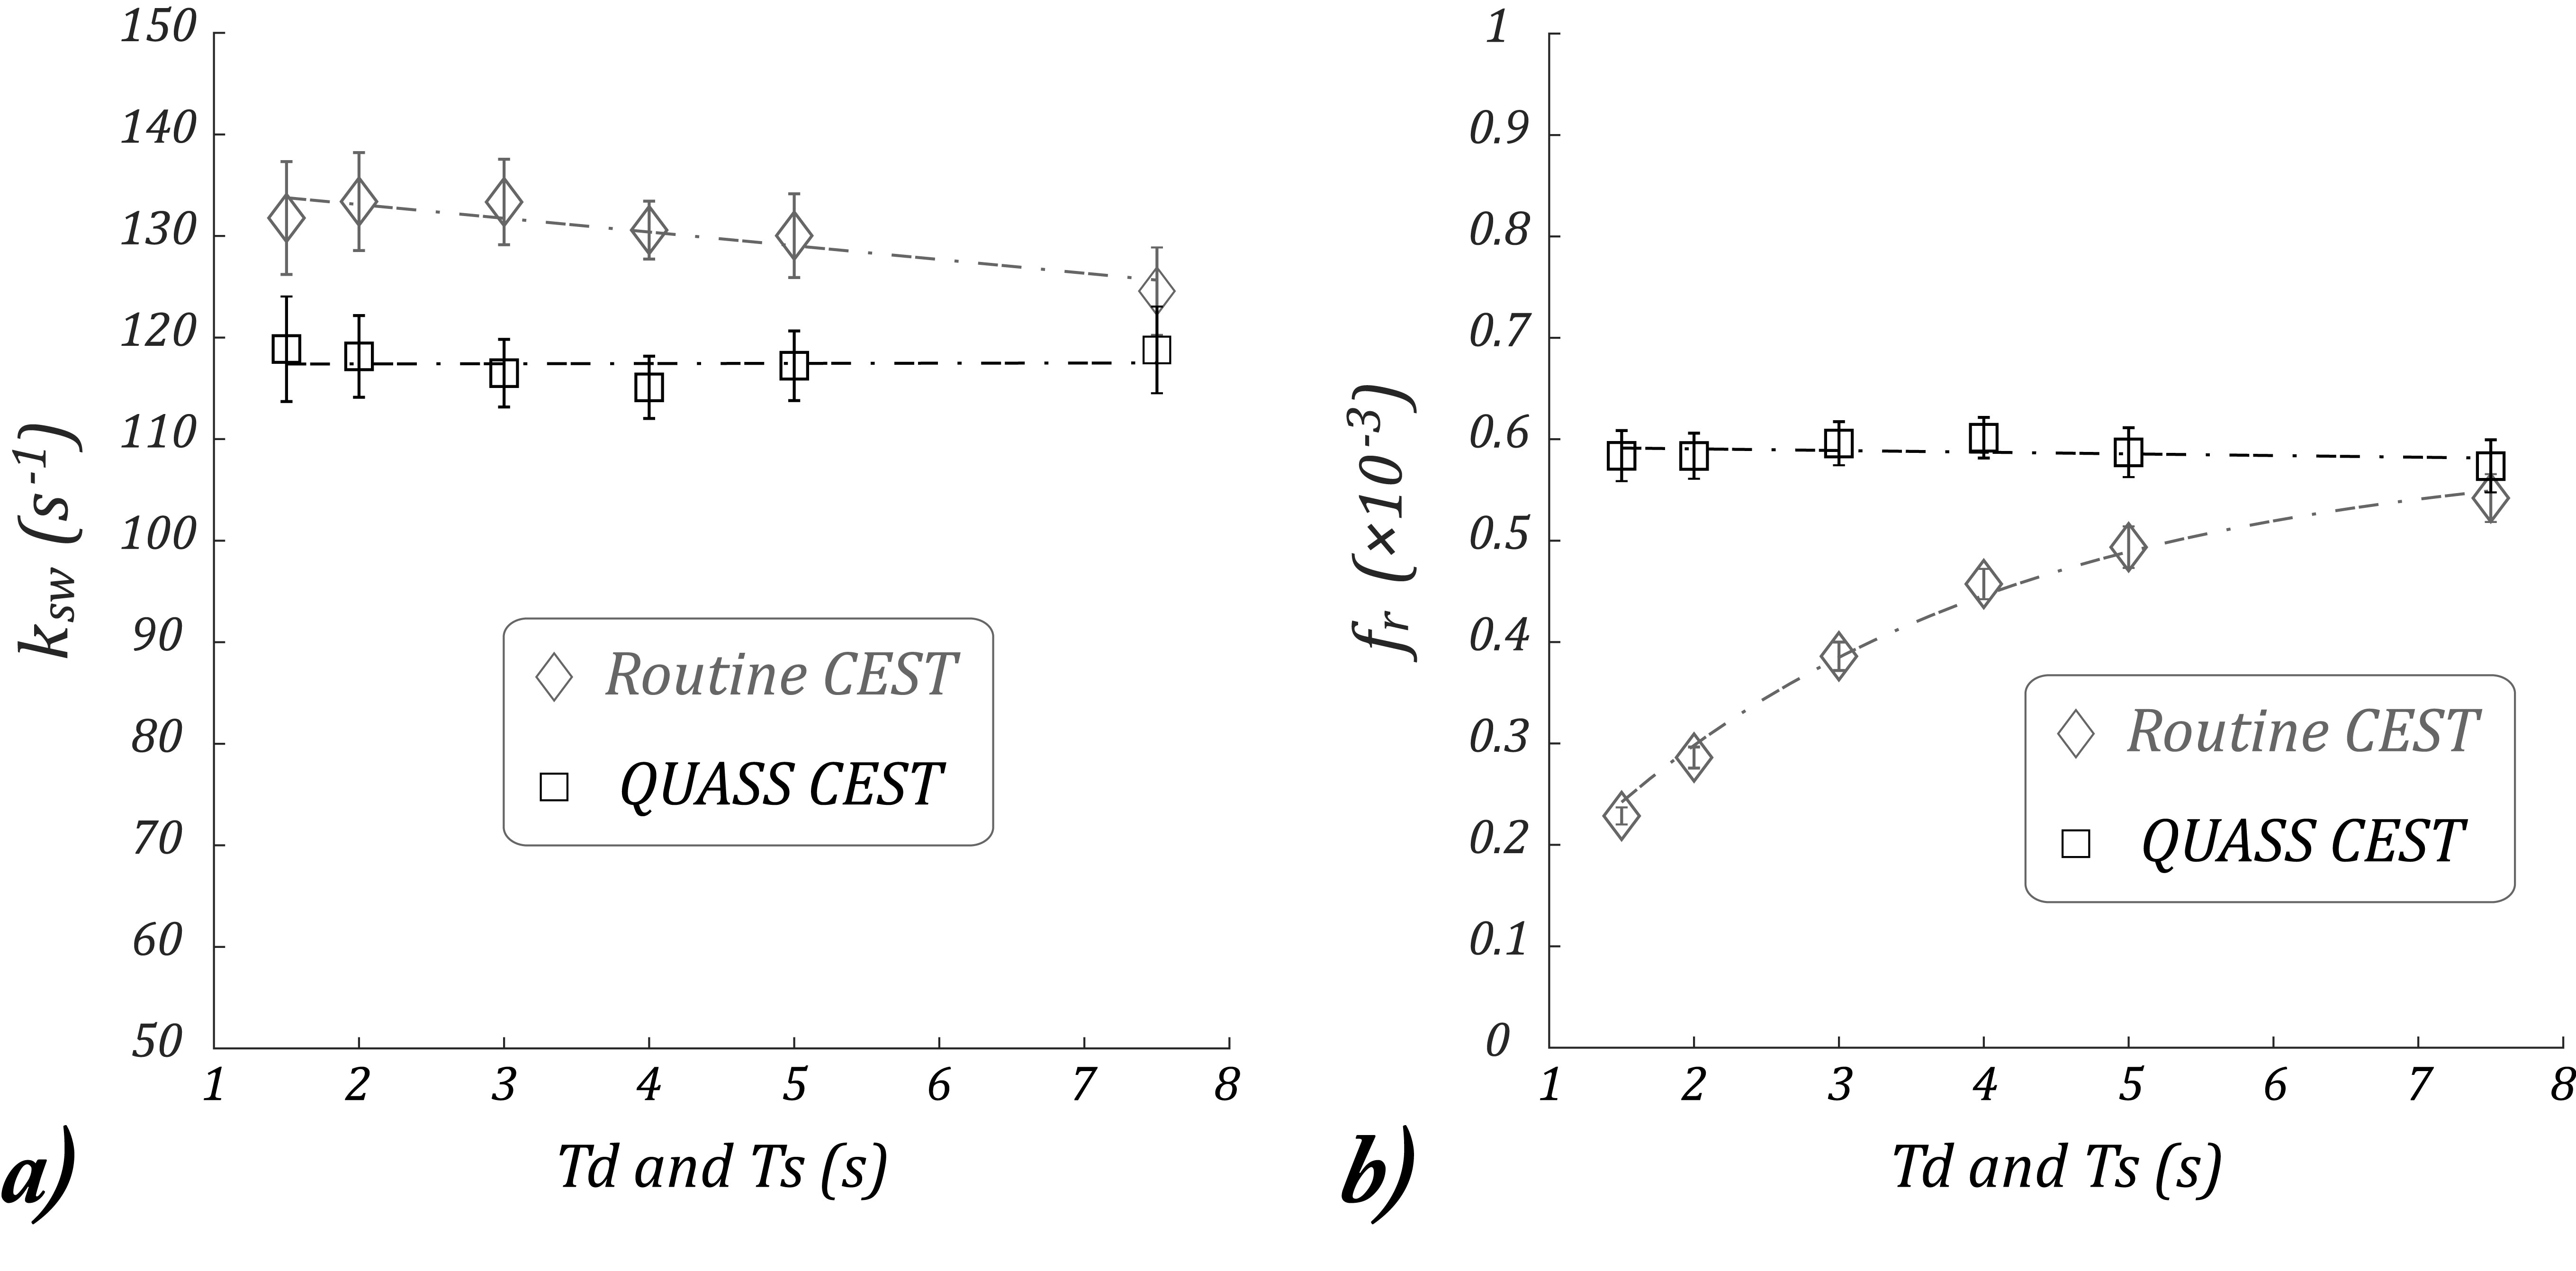
Fig. 4., The relationship between Td/Ts with the
experimentally determined ksw
and fr. a) ksw from the conventional CEST MRI (circle markers) showed a significant linear dependence with Ts/Td. In
comparison, ksw determined
from the QUASS CEST MRI (square markers) did not show significant dependence with respect to Ts/Td.
c) fr determined from conventional
apparent CEST MRI (circle markers) can be described by a stretched exponential function with
significant dependence on Ts/Td. d) fr
determined from the QUASS CEST MRI (square markers) showed no significant dependence on Ts/Td.