Ying Liu1,2, Botao Zhao1,2, and Xiao-Yong Zhang1,2
1Institute of Science and Technology for Brain-Inspired Intelligence, Fudan University, Shanghai, China, 2Key Laboratory of Computational Neuroscience and Brain-Inspired Intelligence (Fudan University), Ministry of Education, Shanghai, China
1Institute of Science and Technology for Brain-Inspired Intelligence, Fudan University, Shanghai, China, 2Key Laboratory of Computational Neuroscience and Brain-Inspired Intelligence (Fudan University), Ministry of Education, Shanghai, China
We compared several tumor endogenous
pH mapping methods using CEST at 11.7T. All of these pH-weighted contrasts showed a pH correlation, while the pH enhanced and APT methods were not
concentration-independent and the sensitivity of AACID was affected by the weak
amine signals at 2.7ppm.
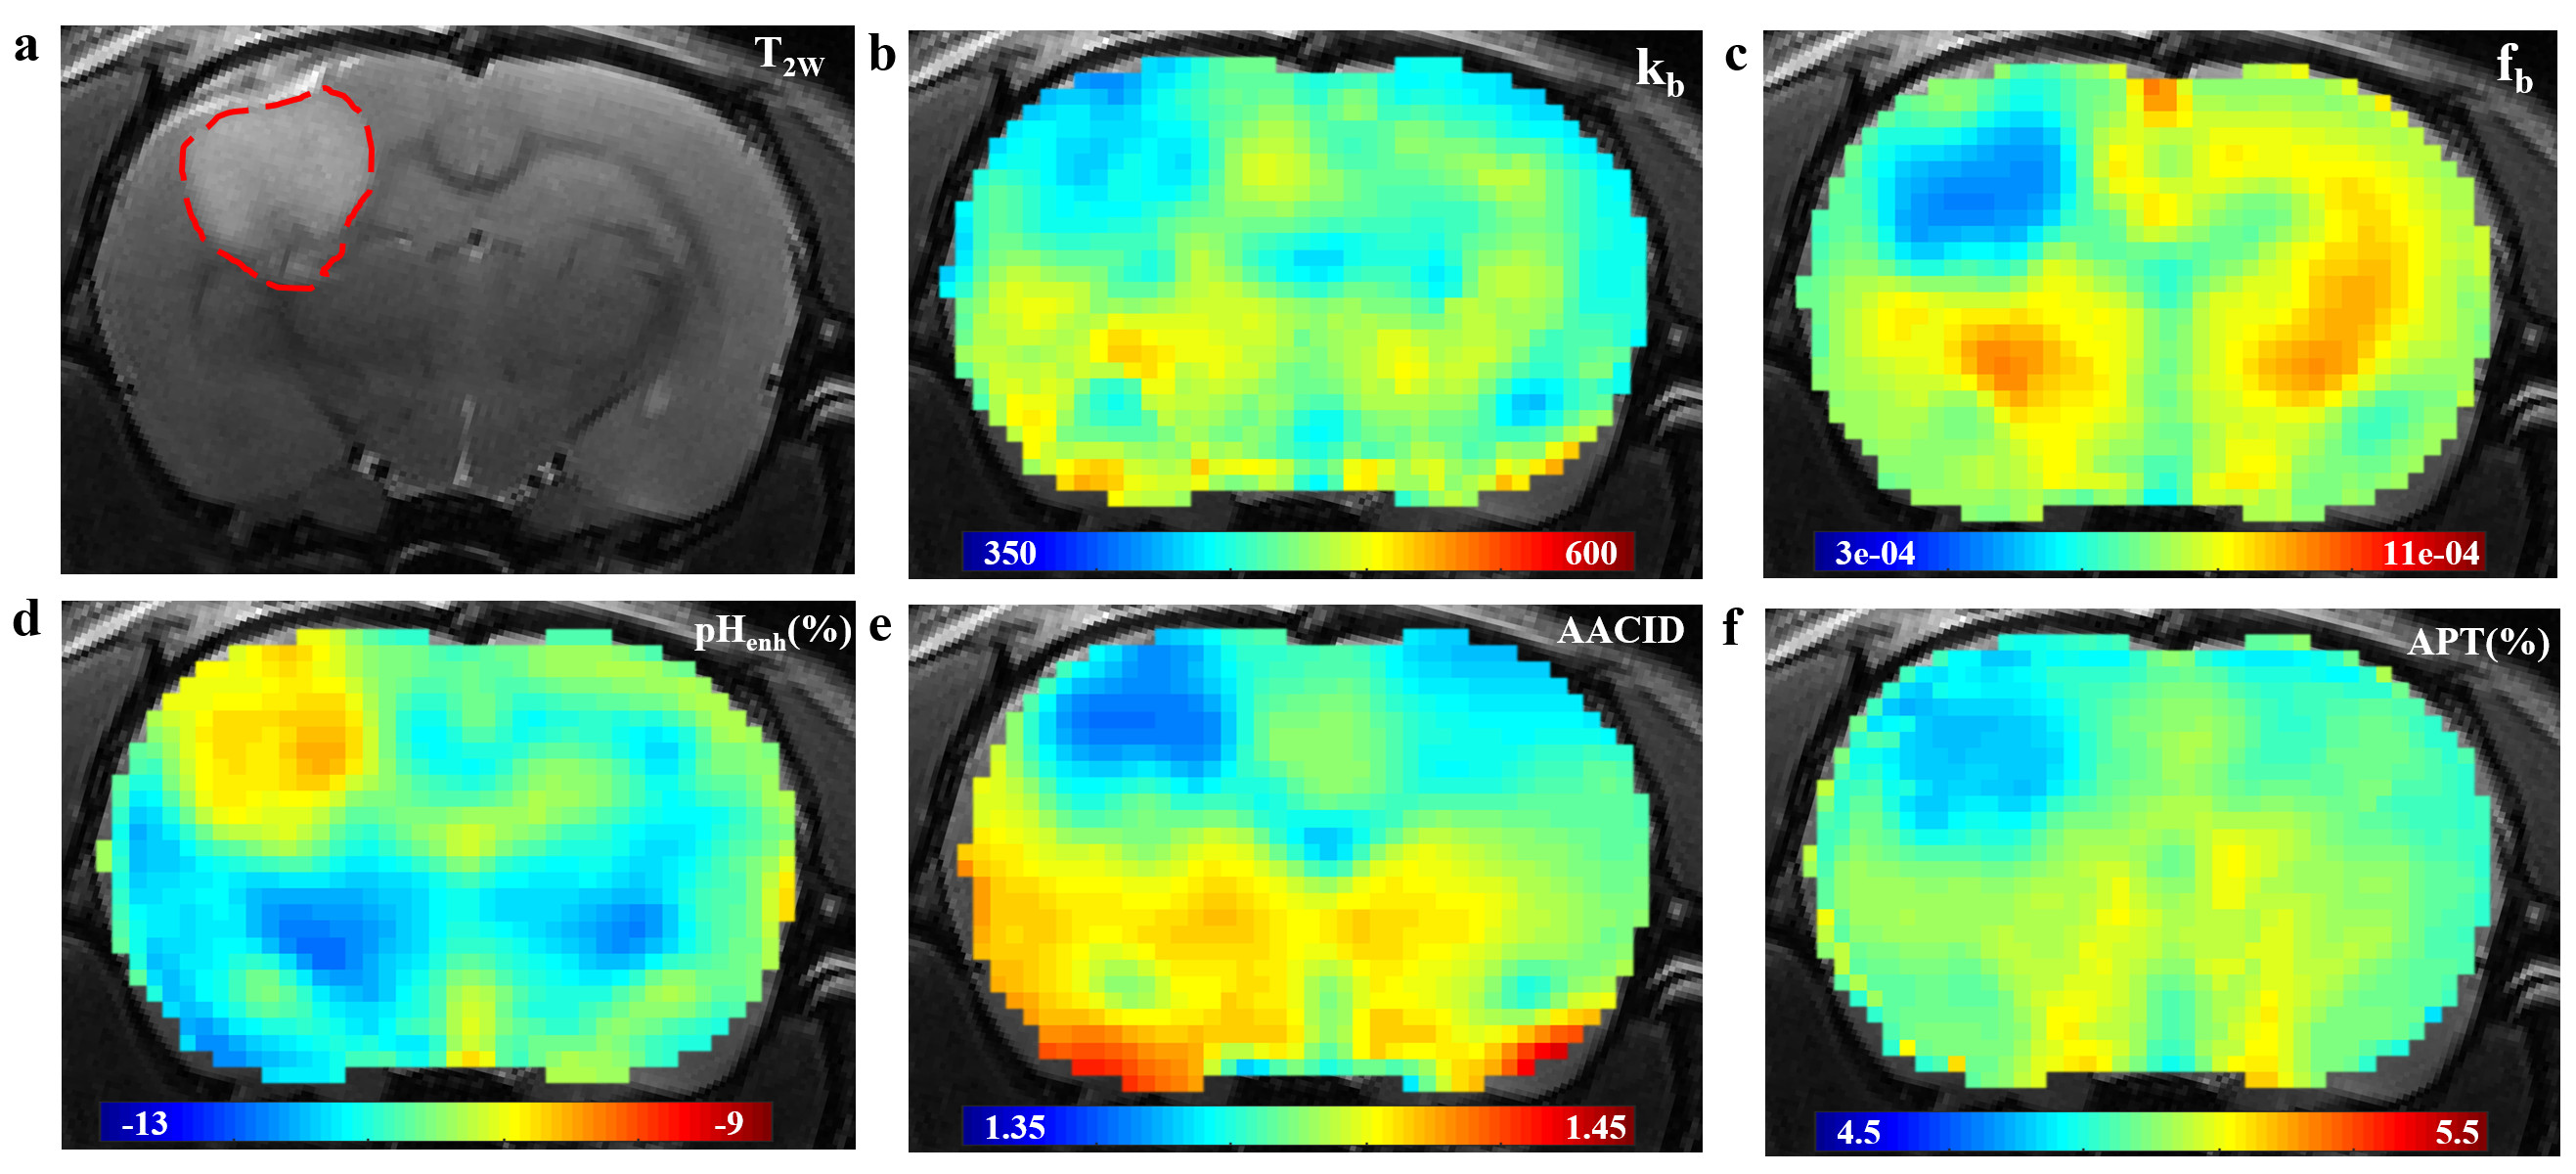
Fig. 2. Representative examples of structural
image and CEST maps of one mouse brain. (a)T2W image with tumor
region delineated by the red dotted line. (b), (c) Representative proton
exchange rate and labile proton ratio maps. (d), (e), (f) pH weighted contrasts
calculated using pH enhanced method, AACID method and amide proton transfer
(APT) MRI.
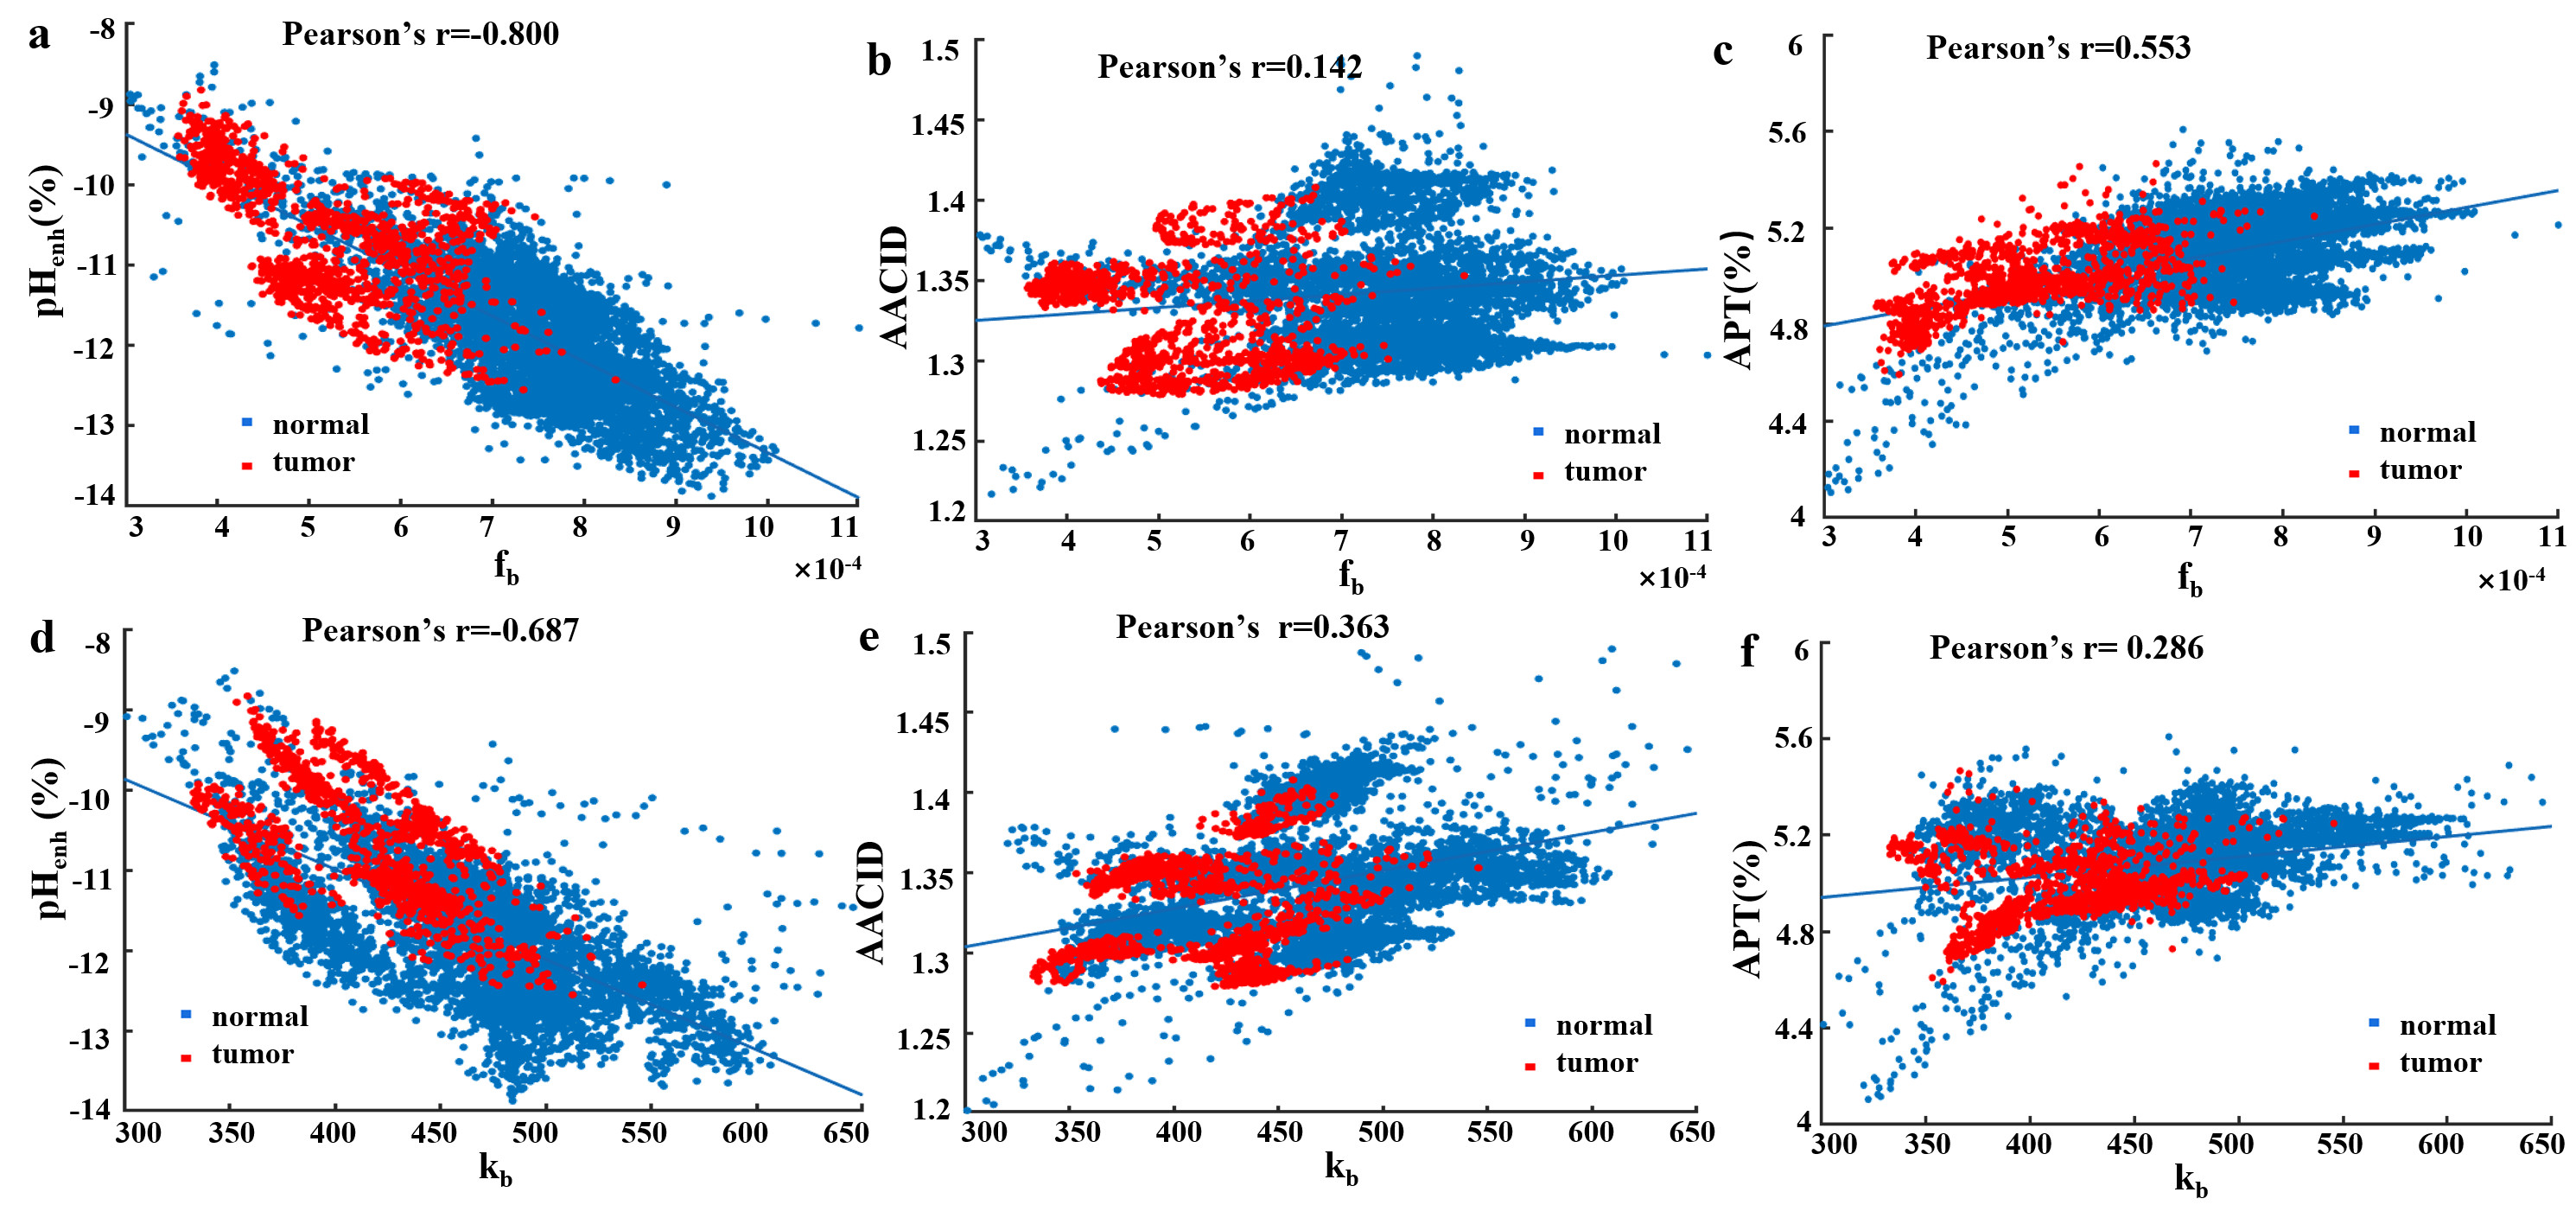
Fig. 3. Association between labile
proton
ratio (fb) , chemical exchange rate (kb) values and AACID (a) (d)
,pHenh
(b)
(e),
APT(c)
(f) values
of
all voxels in 6 mice brain from tumors (red points) and normal tissue (blue
points).