Fatemeh Adelnia1, Zhongliang Zu1,2, Feng Wang1,2, Kevin D Harkins3, and John C Gore1,2,3,4,5
1Vanderbilt University Institute of Imaging Science, Nashville, TN, United States, 2Department of Radiology and Radiological Sciences, Vanderbilt University Medical Center, Nashville, TN, United States, 3Department of Biomedical Engineering, Vanderbilt University, Nashville, TN, United States, 4Department of Physics and Astronomy, Vanderbilt University, Nashville, TN, United States, 5Department of Molecular Physiology and Biophysics, Vanderbilt University, Nashville, TN, United States
1Vanderbilt University Institute of Imaging Science, Nashville, TN, United States, 2Department of Radiology and Radiological Sciences, Vanderbilt University Medical Center, Nashville, TN, United States, 3Department of Biomedical Engineering, Vanderbilt University, Nashville, TN, United States, 4Department of Physics and Astronomy, Vanderbilt University, Nashville, TN, United States, 5Department of Molecular Physiology and Biophysics, Vanderbilt University, Nashville, TN, United States
R1ρ dispersion over a range of weak locking
fields has the potential to reveal information on microvascular geometry and
density. This work presents in-vivo
results supporting the application of this technique to the measurement of microvascular sizes and
spacings in skeletal muscle.
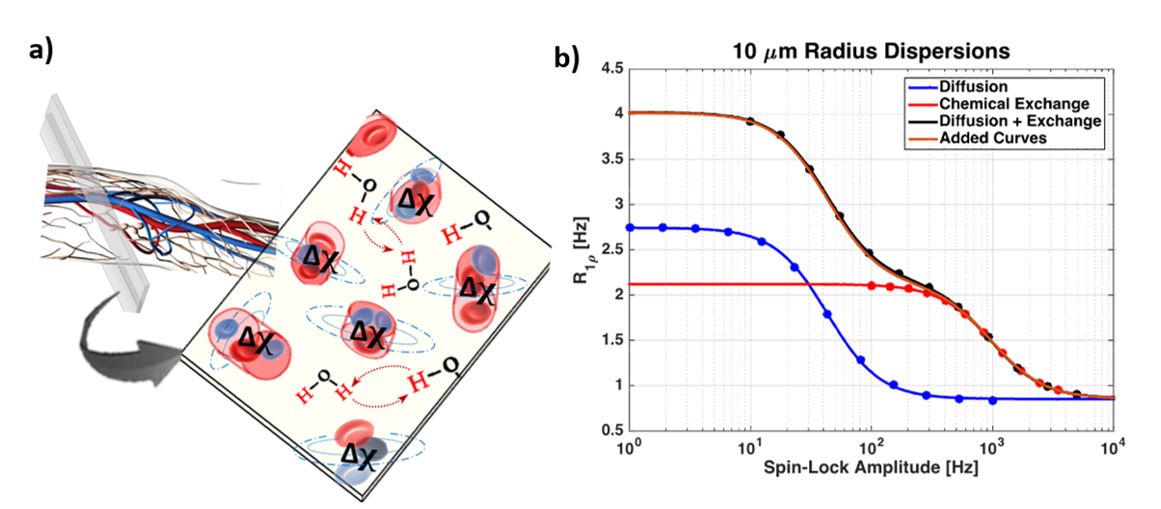
Fig 1. a) Schematic diagram of an imaging voxel illustrating
the chemical exchange of labile hydrogen, between water and hydroxyls,
occurring in the presence of susceptibility gradients generated by the red
blood cells containing paramagnetic deoxyhemoglobin. b) Simulated R1ρ
dispersions for a spherical structure with a radius of 10 μm. The
low-frequency dispersion corresponds to diffusion effects (blue), the high frequency
corresponds to exchange (red), and the composite curve “double dispersion”
added two rates linearly R1ρ =
Rdipolar + R1ρDiff + R1ρEx (adapted from Ref 3).
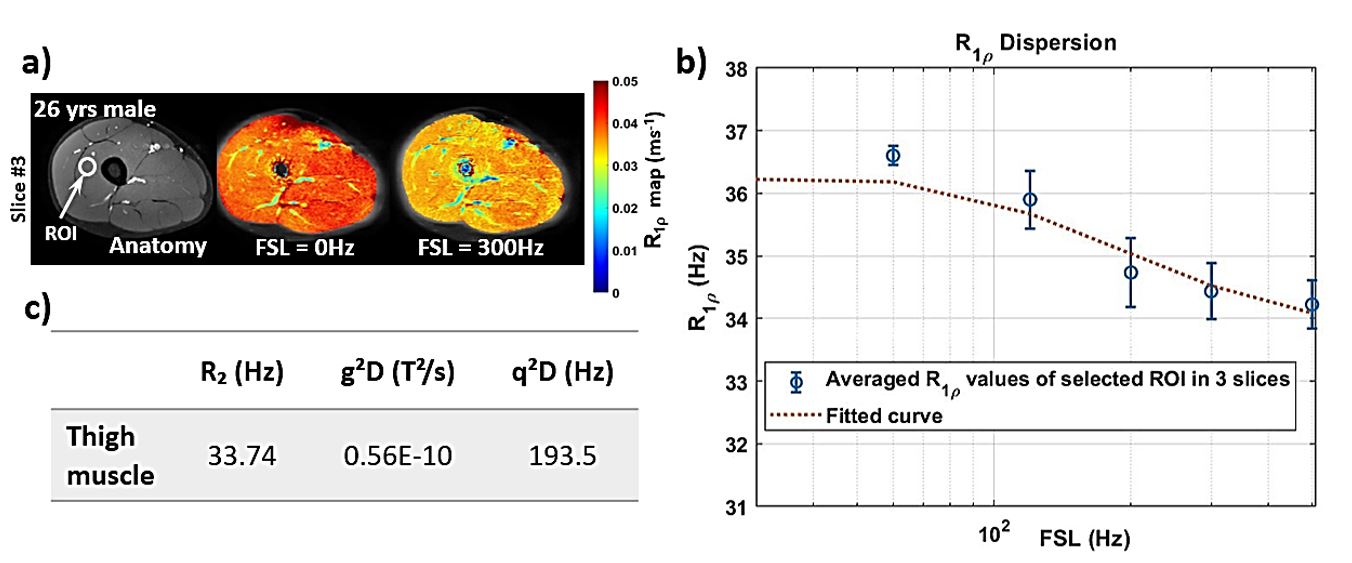
Fig 5. 3D T1ρ images collected with the
anterior coil, Slice N=3, TR
= 1250 ms, shortest TE, SENSE factor 2, a FOV of 224 x 224 mm, and a voxel size
of 1 x1 x 8 mm with TSL; 2, 12, 36 ms and FSL=0, 60, 120, 200, 300, 480 Hz
resulted in a total scan time of 7 min and 56 sec. (a) Example of
anatomy and R1ρ=1/T1ρ maps from slice #3. ROI placed in
the area that has approximately B0 off-set less than 30Hz. (b) Averaged
R1ρ values from selected ROI. The error bars show
the standard deviation. The fitted curve calculated using R1ρ equation
(c) Fitted parameters extracted from R1ρ dispersion depicted
in (b).