Mohsen Mazrooyisebdani1,2, BARBARA B BENDLIN3, Shi-Jiang Li4, and Vivek Prabhakaran1,5,6
1Radiology Department, University of Wisconsin Madison, Madison, WI, United States, 2Electrical and computer Engineering, University of Wisconsin Madison, Madison, WI, United States, 3Department of Medicine, University of Wisconsin Madison, Madison, WI, United States, 4Department of Biophysics, University of Wisconsin Madison, Madison, WI, United States, 5Neuroscience Training program, University of Wisconsin Madison, Madison, WI, United States, 6Medical Scientist Training Program, University of Wisconsin Madison, Madison, WI, United States
1Radiology Department, University of Wisconsin Madison, Madison, WI, United States, 2Electrical and computer Engineering, University of Wisconsin Madison, Madison, WI, United States, 3Department of Medicine, University of Wisconsin Madison, Madison, WI, United States, 4Department of Biophysics, University of Wisconsin Madison, Madison, WI, United States, 5Neuroscience Training program, University of Wisconsin Madison, Madison, WI, United States, 6Medical Scientist Training Program, University of Wisconsin Madison, Madison, WI, United States
The global topology of brain network in AD&MCI remains the same as the healthy control. However, there is some major deviations in the importance of the brain regions in the network structure between AD&MCI and healthy controls across different parts of the brain.
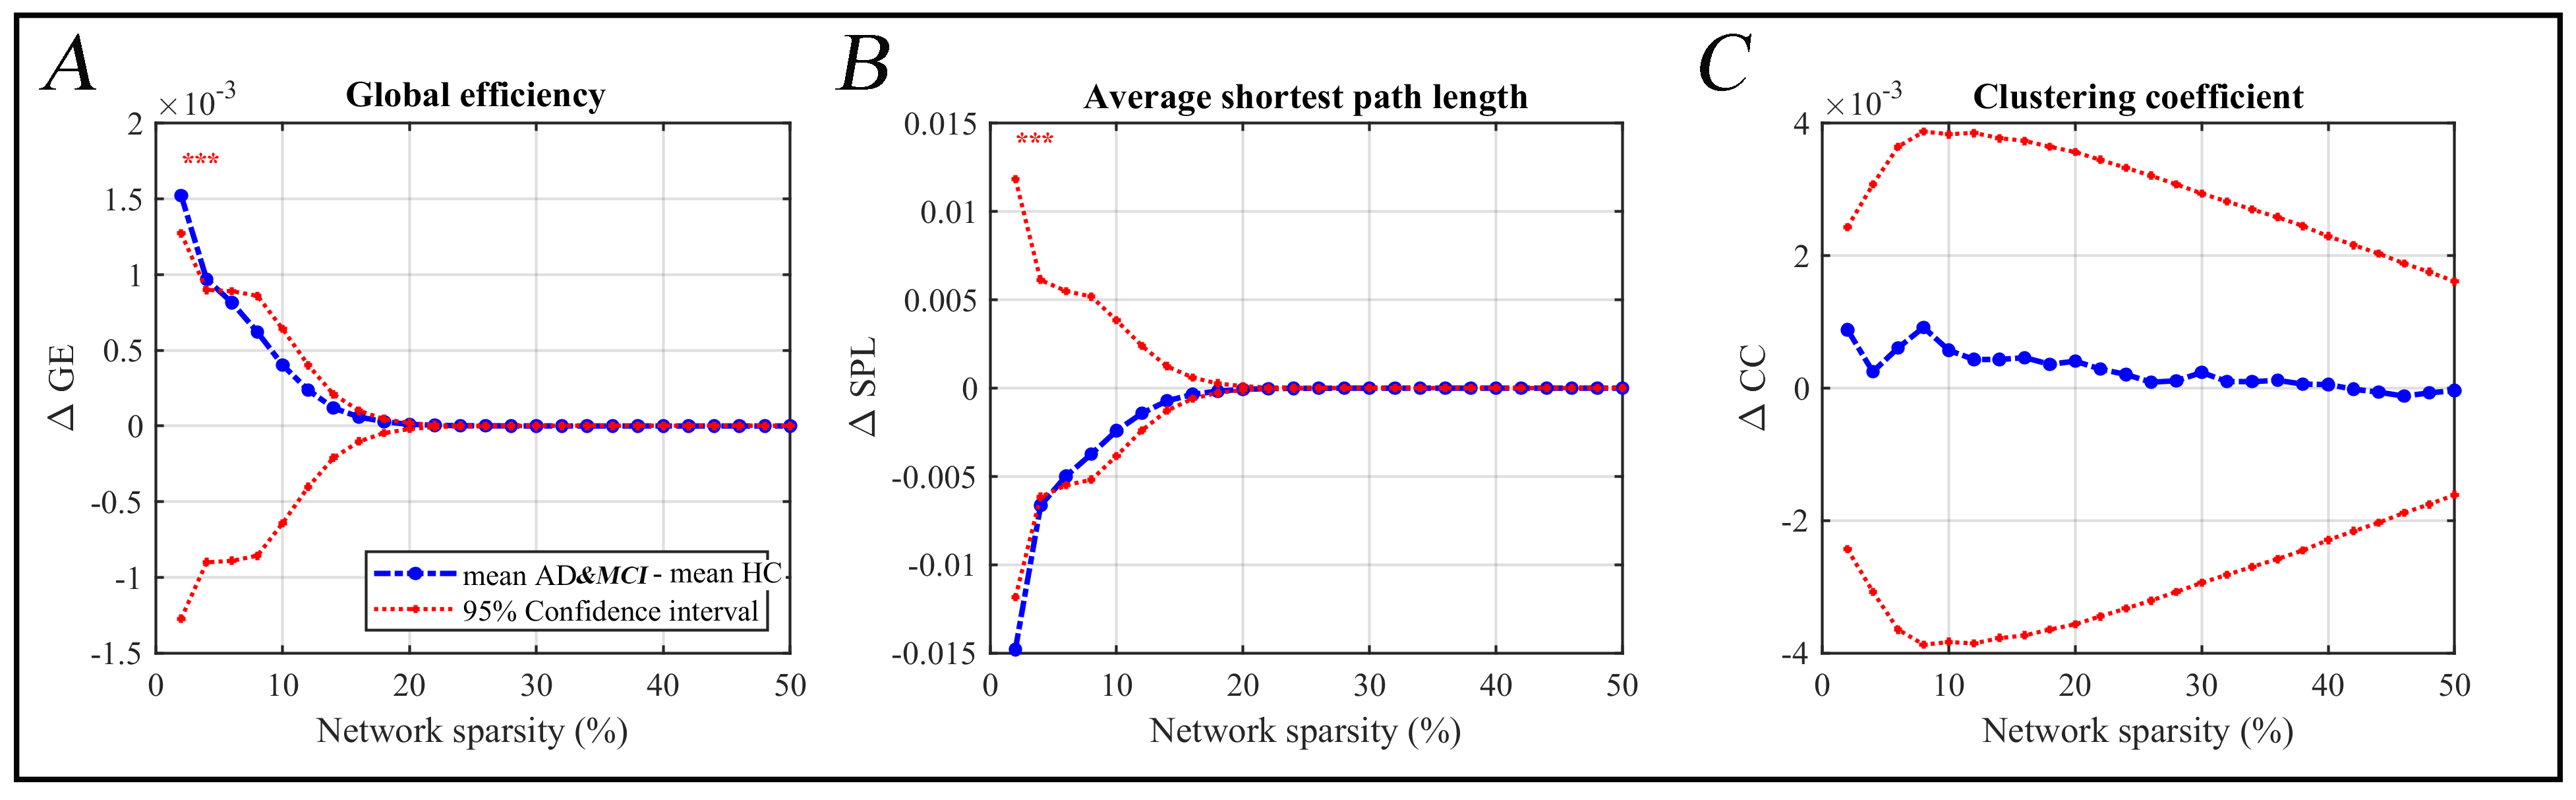
Figure 2. Comparison
of global network properties between patients with Alzheimer and MCI (AD
&MCI) and healthy control (HC) in (A) global efficiency, (B) average
shortest path length and (C) clustering coefficient as a function of network
sparsity. Blue dots show difference between mean AD&MCI and HC for each
measurement at each specific network sparsity. The red dot-lines show 95%
confidence interval of the null distribution obtained from 20000 permutation
tests at each density value. Asterisks (red) indicate significant between-group
differences (P < 0.05).
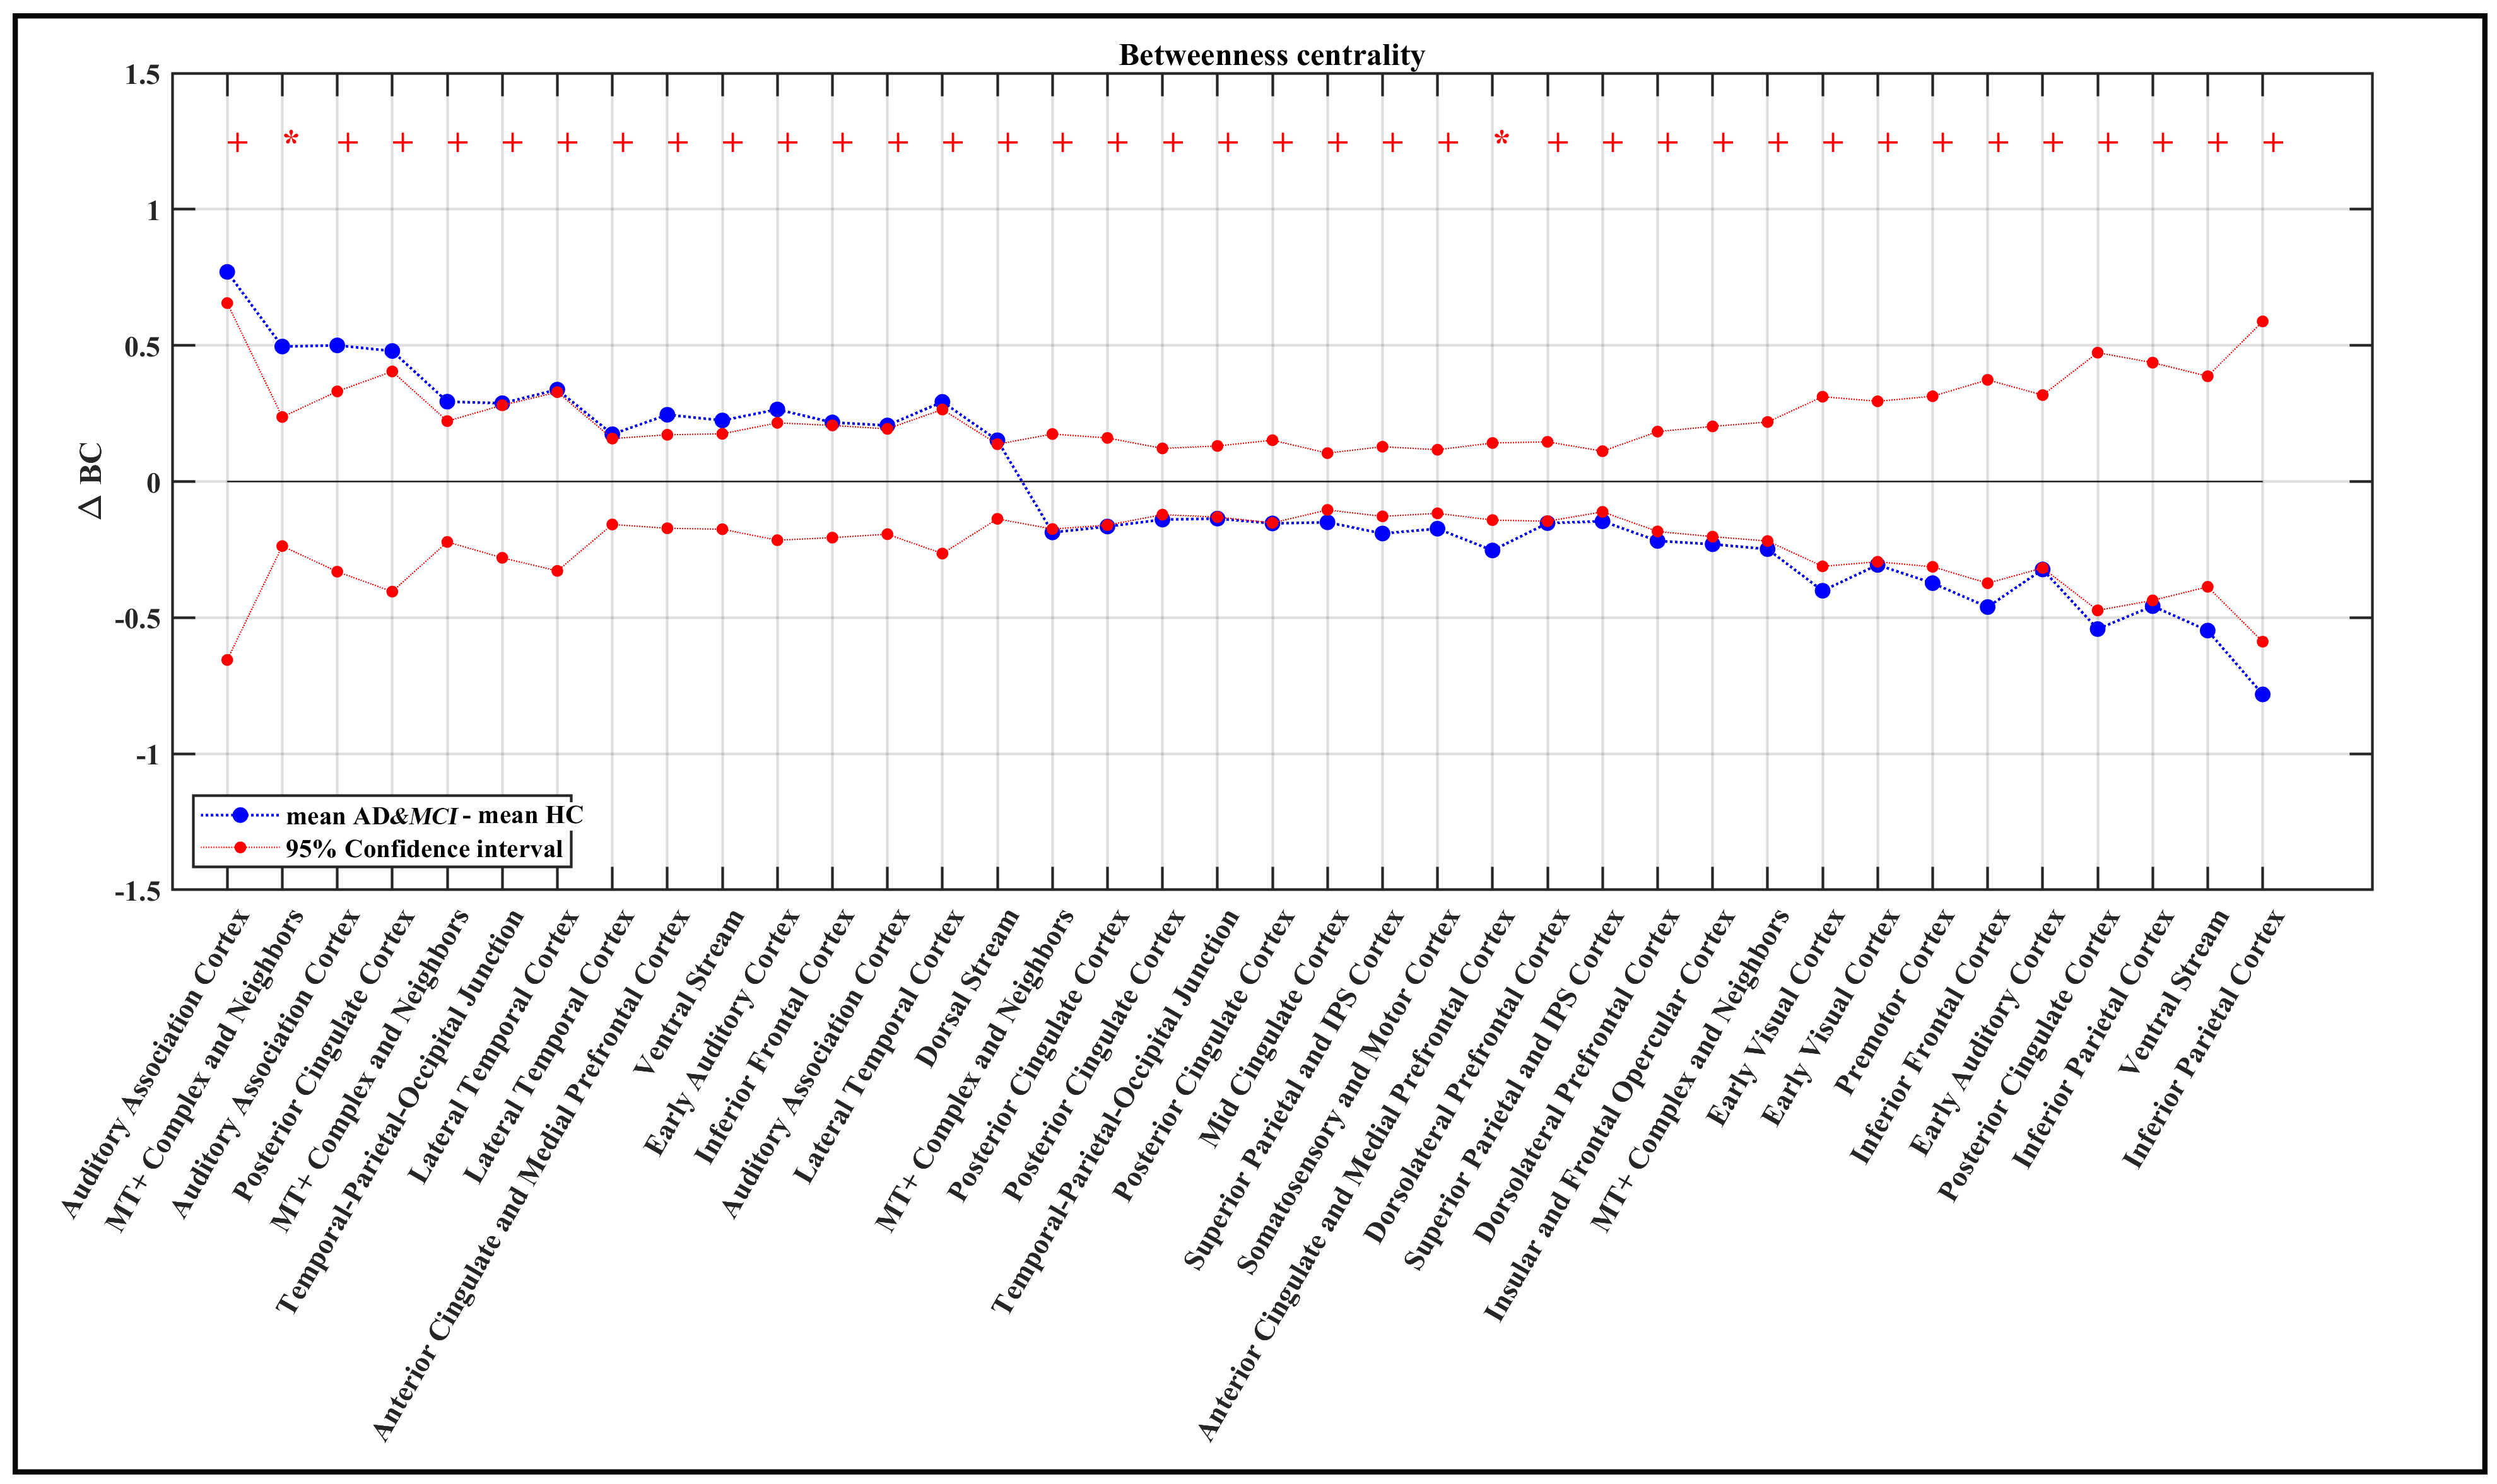
Figure
3. Differences between Alzheimer and MCI (AD
&MCI) and HC in betweenness centrality (BC). Blue dots show the mean AD –
mean HC for each measurement in each specific node. Nodes are represented by
their associated Glasser’s regions [4] and not Glasser’s labels. Hence there
are multiple ROIs with one name. The red dot-lines show 95% confidence interval of the
null distribution obtained from 20000
permutation tests at each node. Red asterisks indicate significant
between-group differences (Adjusted P < 0.05) and pluses indicate trend
toward significant (Adjusted P < 0.1).