Krishnapriya Venugopal1, Esther A.H Warnert1, Daniëlle van Dorth2, Marion Smits1, Juan Antonio Hernandez Tamames1, Matthias J.P van Osch2, and Dirk H.J Poot1
1Radiology and Nuclear Medicine, Erasmus MC, Rotterdam, Netherlands, 2Radiology, Leiden University Medical Center, Leiden, Netherlands
1Radiology and Nuclear Medicine, Erasmus MC, Rotterdam, Netherlands, 2Radiology, Leiden University Medical Center, Leiden, Netherlands
Dictionaries were simulated for
DSC-MRI time courses with GRE and SE read-out. The fingerprints from
in-vivo healthy and glioma data were matched and resulted in estimations of
cerebral blood volume, vessel radius and permeability.
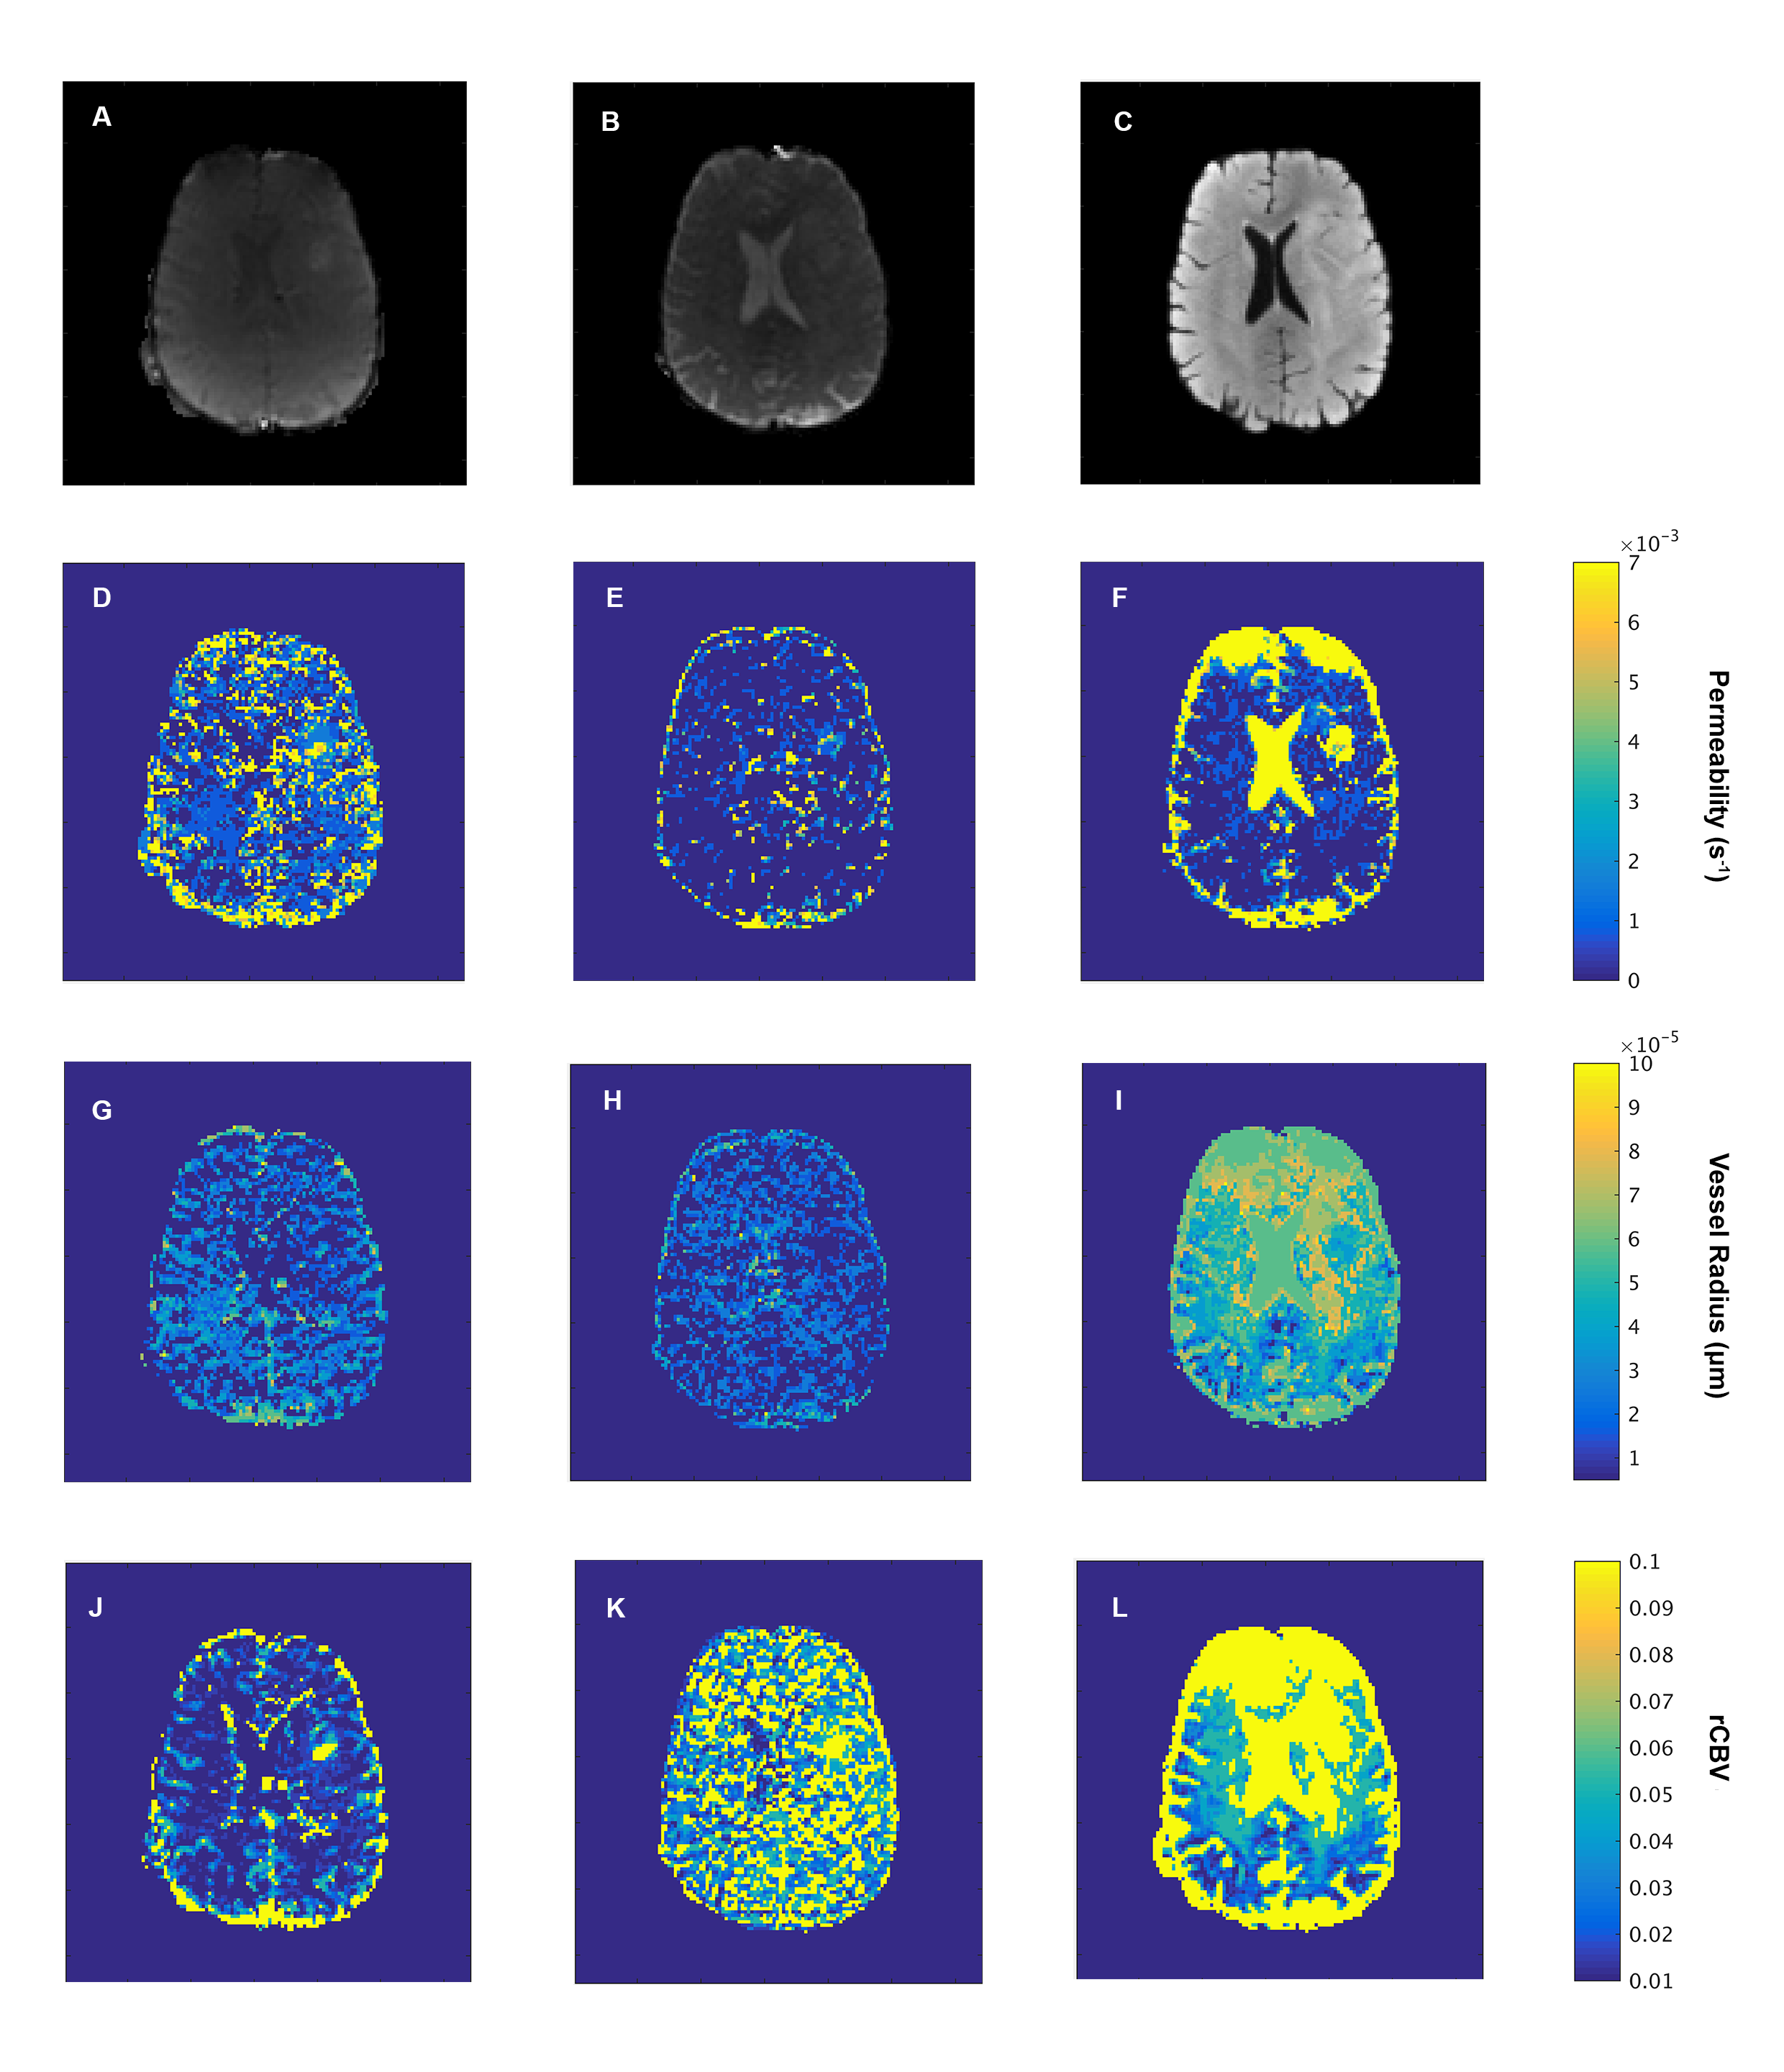
Figure 3. GRE
(A) and SE (B) images from HEPI and T2 FLAIR (C) as reference of the patient
brain acquired on the same scanner. D, E, F are the permeability maps, G, H, I
are the vessel radius maps and J, K, L are the rCBV maps in the GRE (D, G, J),
SE (E,H,K) and combined GRE-SE (F, I, L) images.
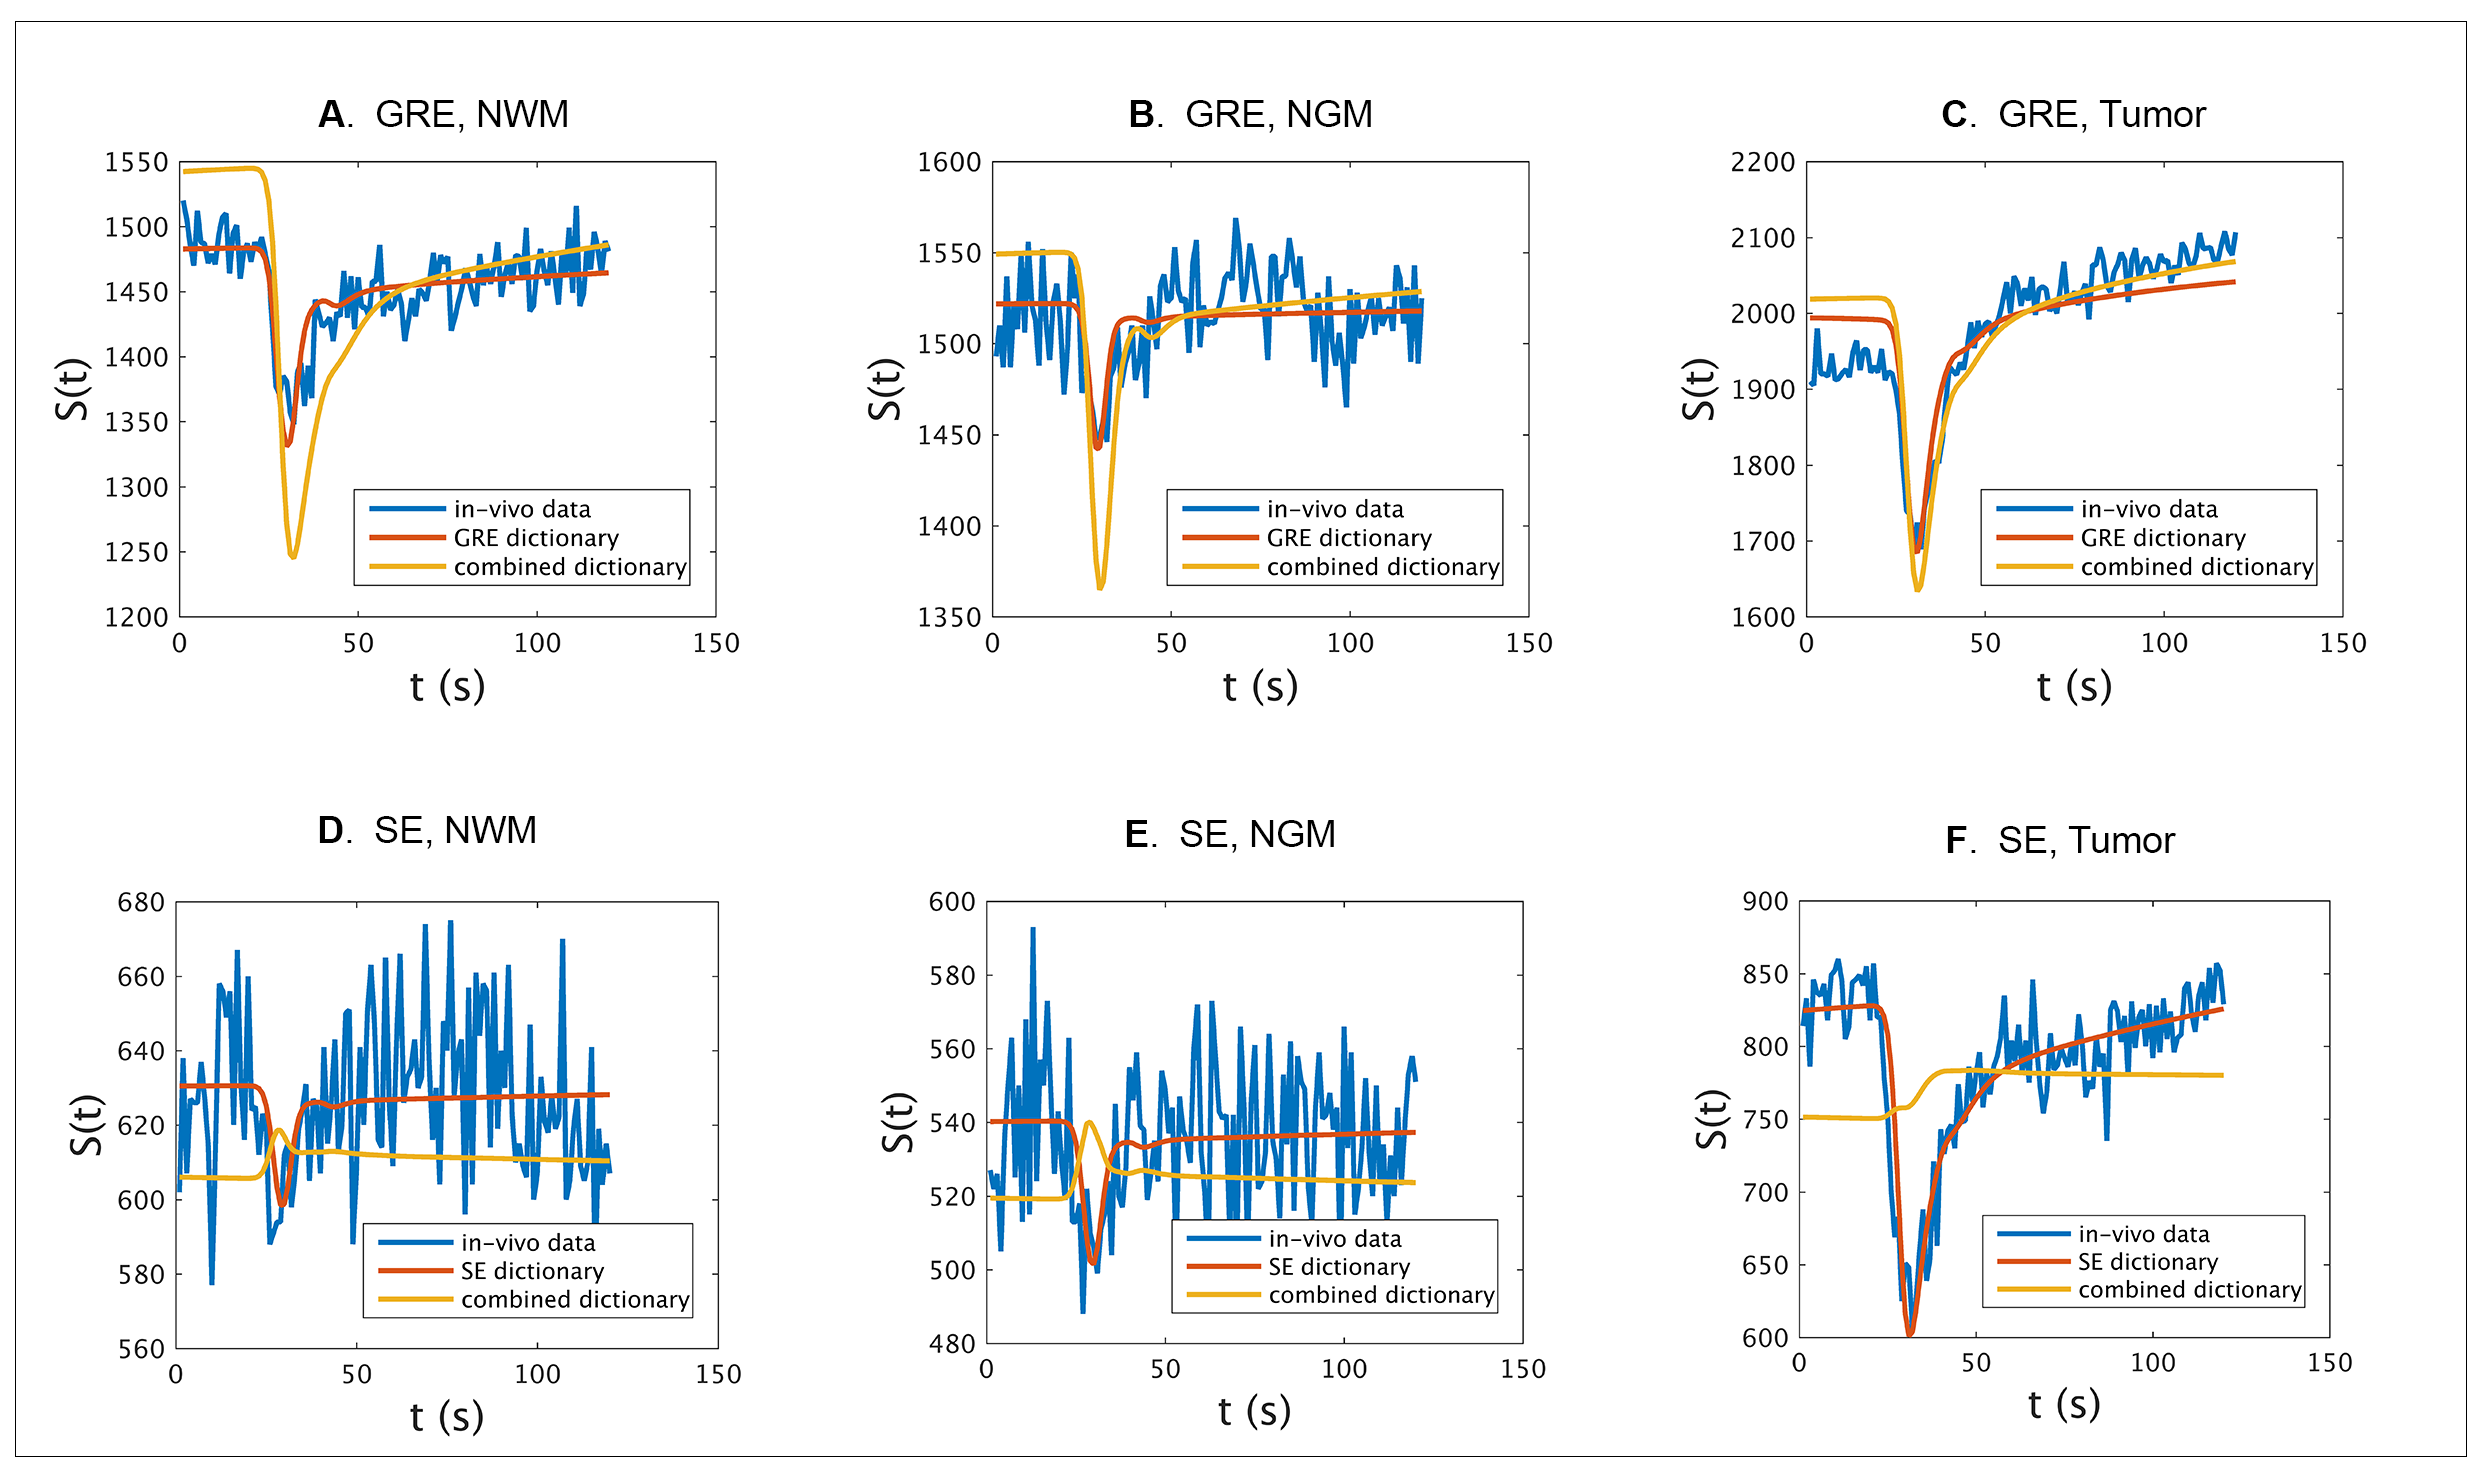
Figure 4.
Comparison of signals from voxels in NWM, NGM and tumor tissues from GRE (A,B,C
respectively) and SE (D,E,F, respectively) images with the signals obtained
from the individual GRE and SE dictionary atoms ( red ) and that from the
respective GRE and SE of the combined dictionary atoms ( yellow ) with maximum
correlation