Joon Yul Yul Choi1, Siyuan Hu2, Ting-yu Su1,2, Yingying Tang1, Ken Sakaie3, Ingmar Blümcke1,4, Imad Najm1, Stephen Jones3, Mark Griswold5, Dan Ma2, and Zhong Irene Wang1
1Epilepsy Center, Neurological Institue, Cleveland Clinic, Cleveland, OH, United States, 2Biomedical Engineering, Case Western Reserve University, Cleveland, OH, United States, 3Imaging Institute, Cleveland Clinic, Cleveland, OH, United States, 4Neuropathology, University of Erlangen, Erlangen, Germany, 5Radiology, Case Western Reserve University, Cleveland, OH, United States
1Epilepsy Center, Neurological Institue, Cleveland Clinic, Cleveland, OH, United States, 2Biomedical Engineering, Case Western Reserve University, Cleveland, OH, United States, 3Imaging Institute, Cleveland Clinic, Cleveland, OH, United States, 4Neuropathology, University of Erlangen, Erlangen, Germany, 5Radiology, Case Western Reserve University, Cleveland, OH, United States
We
investigate T1 and T2 values in Brodmann areas of the normal brain using 3D magnetic
resonance fingerprinting. Our results demonstrate the sensitivity of
multi-parametric MRF results at 3T to differentiate cortical regions with different
cyto- or myelo-architecture.
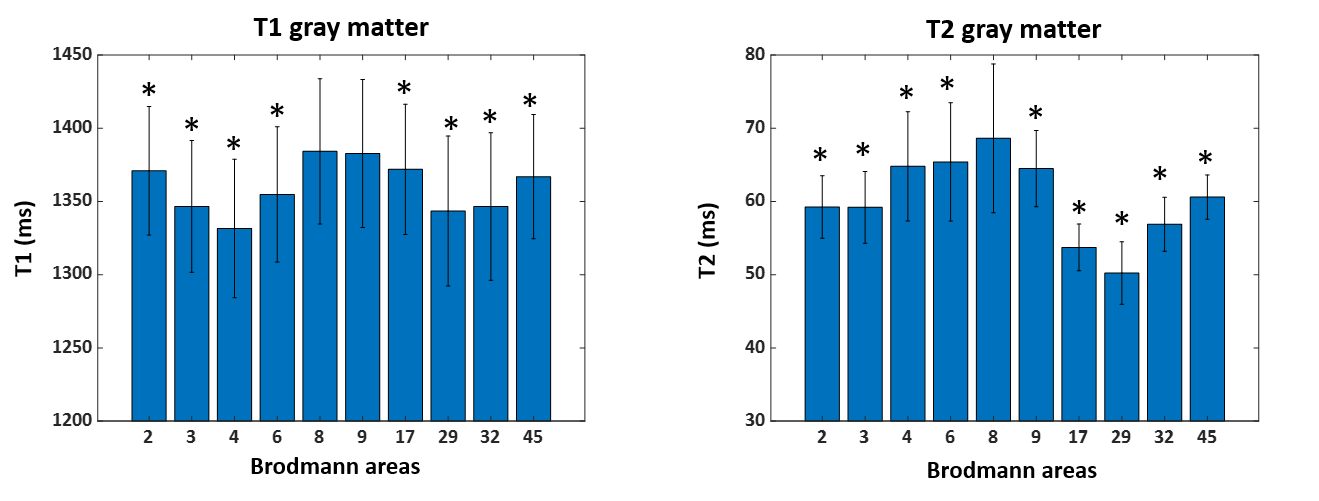
Figure 2. Mean and
standard deviation of MRF T1 and T2 values of gray matter in selected Brodmann
areas. Paired t-test was performed between Brodmann areas 8 and the other
areas. p* < 0.05
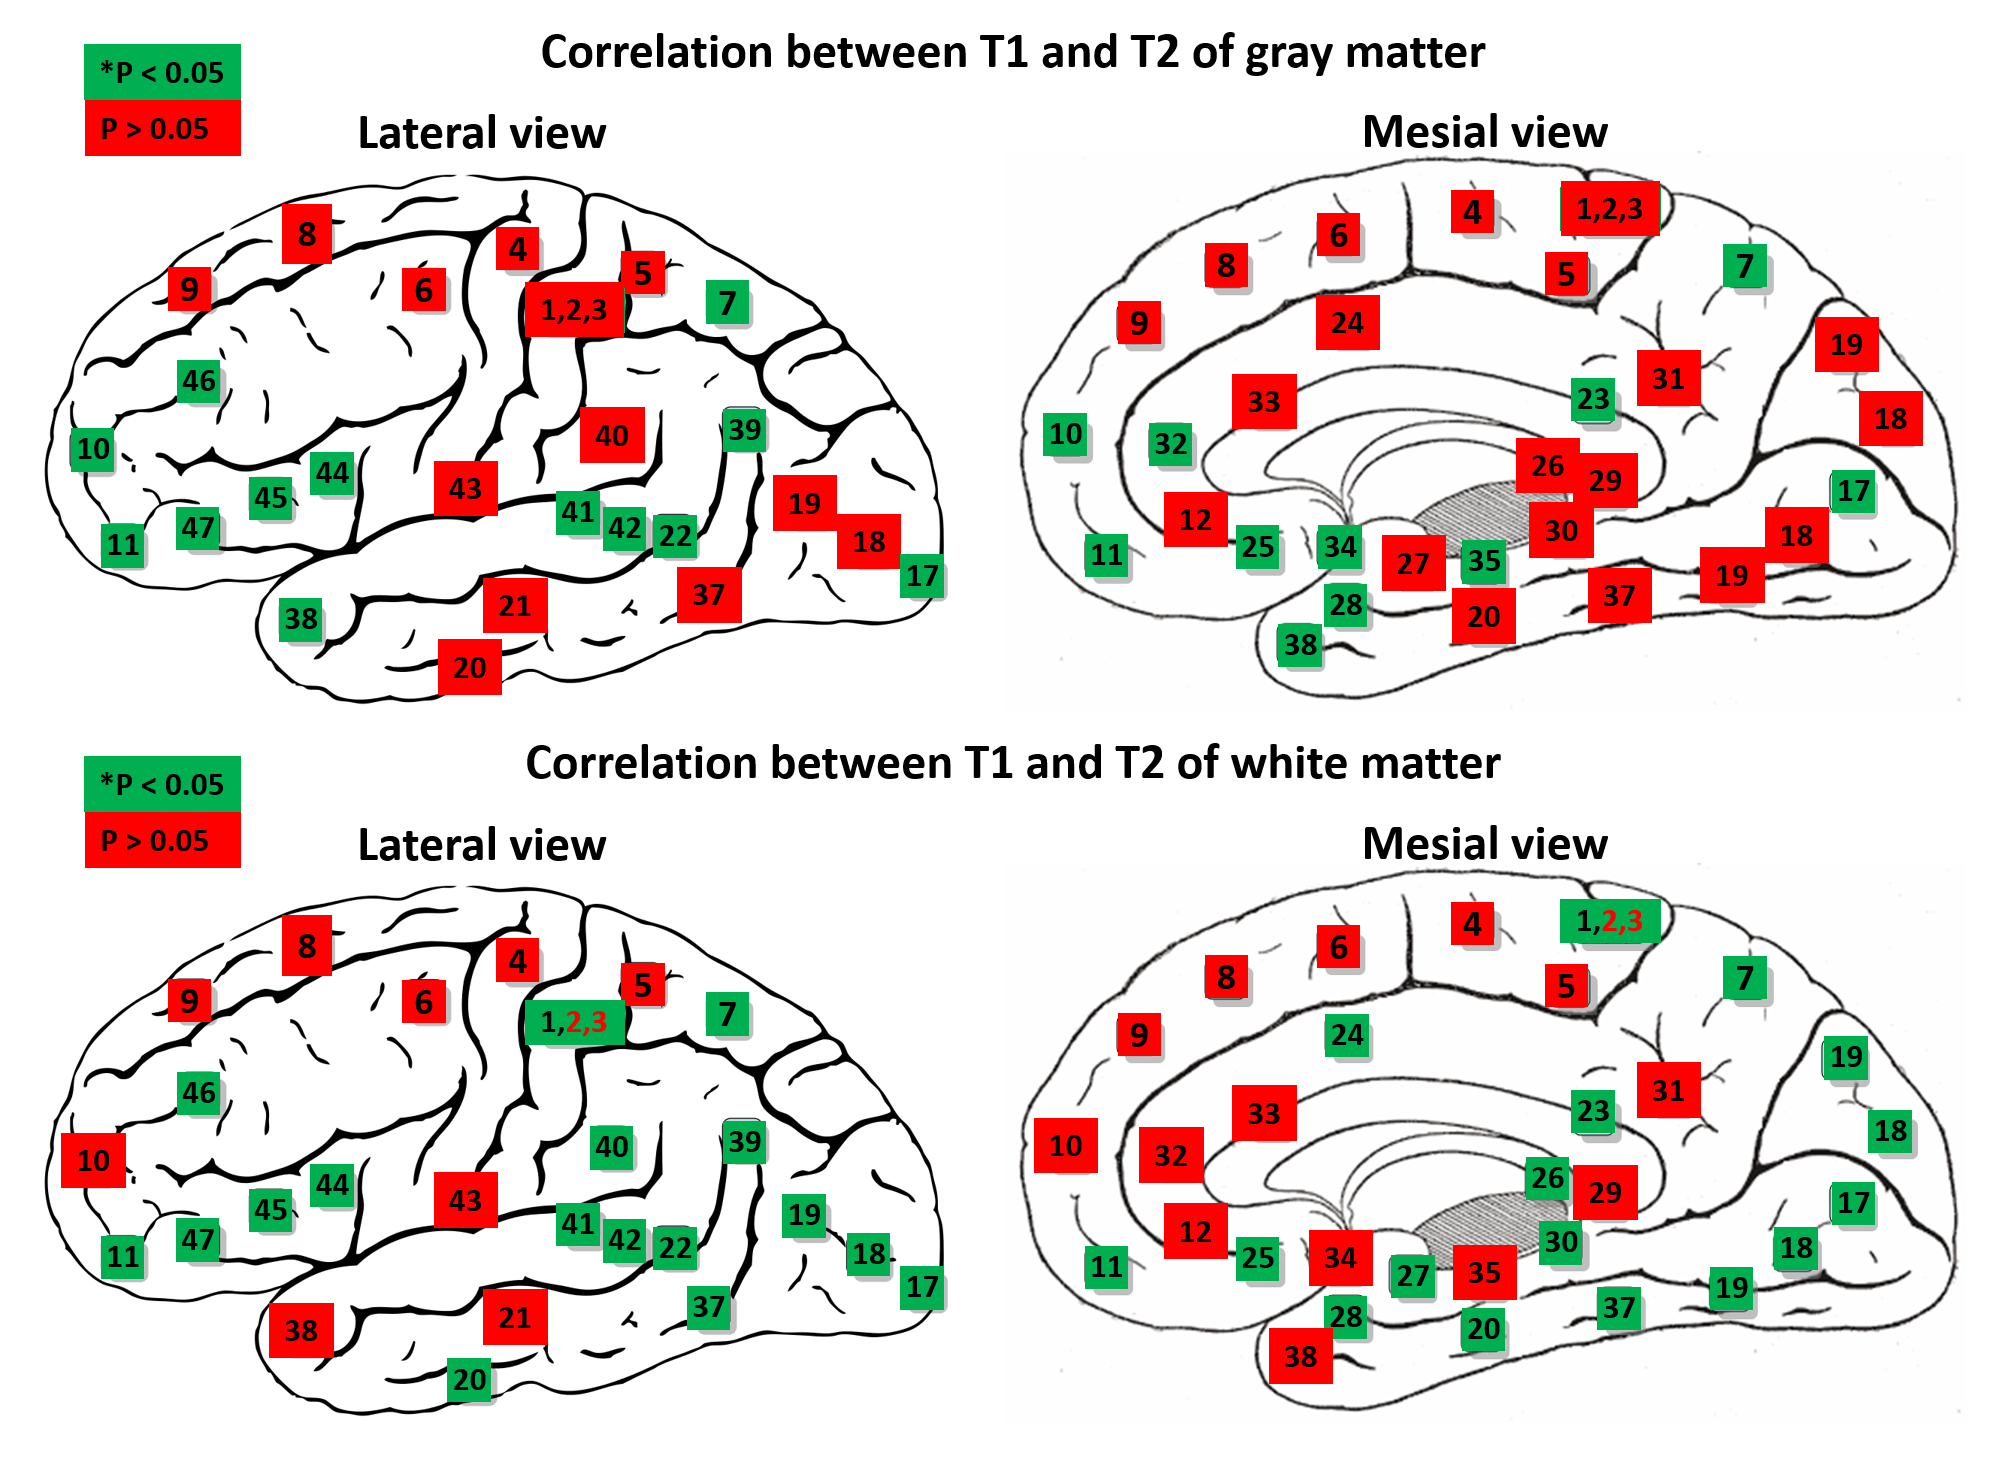
Figure 5.
Correlation analyses between T1 and T2. Spearman’s correlation analysis was
performed in each BA. Green: p* < 0.05, red: p > 0.05