Marissa DiPiero1,2, Janet Lainhart2,3, Brittany Travers2,4, Andrew Alexander 2,3,5, and Doug Dean2,6
1Neuroscience Training Program, University of Wisconsin - Madison, Madison, WI, United States, 2Waisman Center, University of Wisconsin - Madison, Madison, WI, United States, 3Department of Psychiatry, University of Wisconsin - Madison, Madison, WI, United States, 4Department of Kinesiology, University of Wisconsin - Madison, Madison, WI, United States, 5Department of Medical Physics, University of Wisconsin - Madison, Madison, WI, United States, 6Department of Pediatrics, University of Wisconsin - Madison, Madison, WI, United States
1Neuroscience Training Program, University of Wisconsin - Madison, Madison, WI, United States, 2Waisman Center, University of Wisconsin - Madison, Madison, WI, United States, 3Department of Psychiatry, University of Wisconsin - Madison, Madison, WI, United States, 4Department of Kinesiology, University of Wisconsin - Madison, Madison, WI, United States, 5Department of Medical Physics, University of Wisconsin - Madison, Madison, WI, United States, 6Department of Pediatrics, University of Wisconsin - Madison, Madison, WI, United States
Main findings demonstrate the sensitivity of NODDI-GBSS to characterize age-related cortical gray matter differences in people with autism spectrum disorder. Such advancements will contribute to our understanding of brain dysfunction related to ASD.
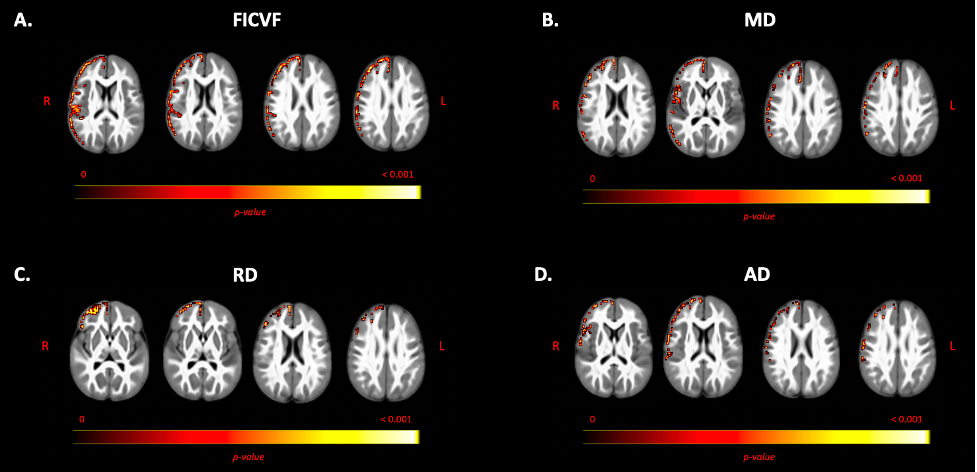
Figure 2: NODDI and DTI group differences. Color bar indicates level of significance of voxels from group difference model. A. Significant voxels and neuroanatomical location of FICVF group differences. B. Significant voxels and neuroanatomical location of MD group differences. C. Significant voxels and neuroanatomical location of RD group differences. D. Significant voxels and neuroanatomical location of AD group differences.
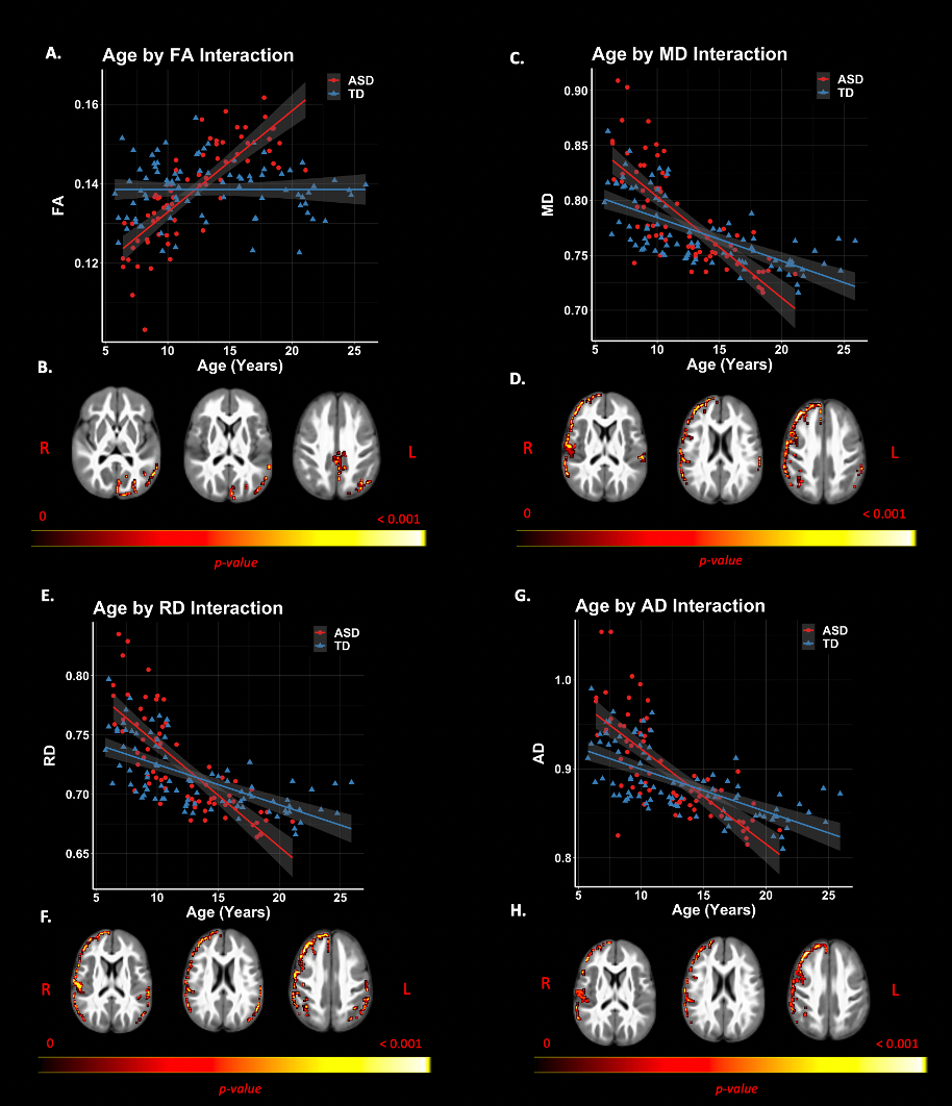
Figure 4: DTI age by group interactions. Significant voxels displayed on the neuroanatomical maps, color bar indicates level of significance (B, D, F, H). A. Scatter plot representing mean FA values of significant voxels of age-by-group interaction. C. Scatter plot representing MD values of significant voxels of age-by-group interaction. E. Scatter plot representing mean RD values of significant voxels of age-by-group interaction. G. Scatter plot representing mean AD values of significant voxels of age-by-group interaction.