Mariken C.R. Hoegen1,2, Nathalie Doorenweerd1,2,3, Emma M. Broek1, Kieren G. Hollingsworth4, Chiara Marini Bettolo5, Jos G.M. Hendriksen 6,7, Erik H. Niks2,8, Volker Straub3, and Hermien E. Kan1,2
1Department of Radiology, Leiden University Medical Center, Leiden, Netherlands, 2Duchenne Center Netherlands, Leiden, Netherlands, 3John Walton Muscular Dystrophy Research Centre, Newcastle upon Tyne, United Kingdom, 4Translational and Clinical Research Institute, Newcastle University, Newcastle upon Tyne, United Kingdom, 5Faculty of Medical Sciences, John Walton Muscular Dystrophy Research Centre, Newcastle upon Tyne, United Kingdom, 6Expertise Center Kempenhaeghe, Heeze, Netherlands, 7Duchenne Center Netherlands, Heeze, Netherlands, 8Department of Neurology, Leiden University Medical Center, Leiden, Netherlands
1Department of Radiology, Leiden University Medical Center, Leiden, Netherlands, 2Duchenne Center Netherlands, Leiden, Netherlands, 3John Walton Muscular Dystrophy Research Centre, Newcastle upon Tyne, United Kingdom, 4Translational and Clinical Research Institute, Newcastle University, Newcastle upon Tyne, United Kingdom, 5Faculty of Medical Sciences, John Walton Muscular Dystrophy Research Centre, Newcastle upon Tyne, United Kingdom, 6Expertise Center Kempenhaeghe, Heeze, Netherlands, 7Duchenne Center Netherlands, Heeze, Netherlands, 8Department of Neurology, Leiden University Medical Center, Leiden, Netherlands
Our preliminary results show no changes in brain volume over time between groups. We found a consistently lower total grey matter volume and no differences in white matter volume in DMD. Our data suggest that the differences in brain volume in DMD are non-progressive up to ± 20 years of age.
Figure
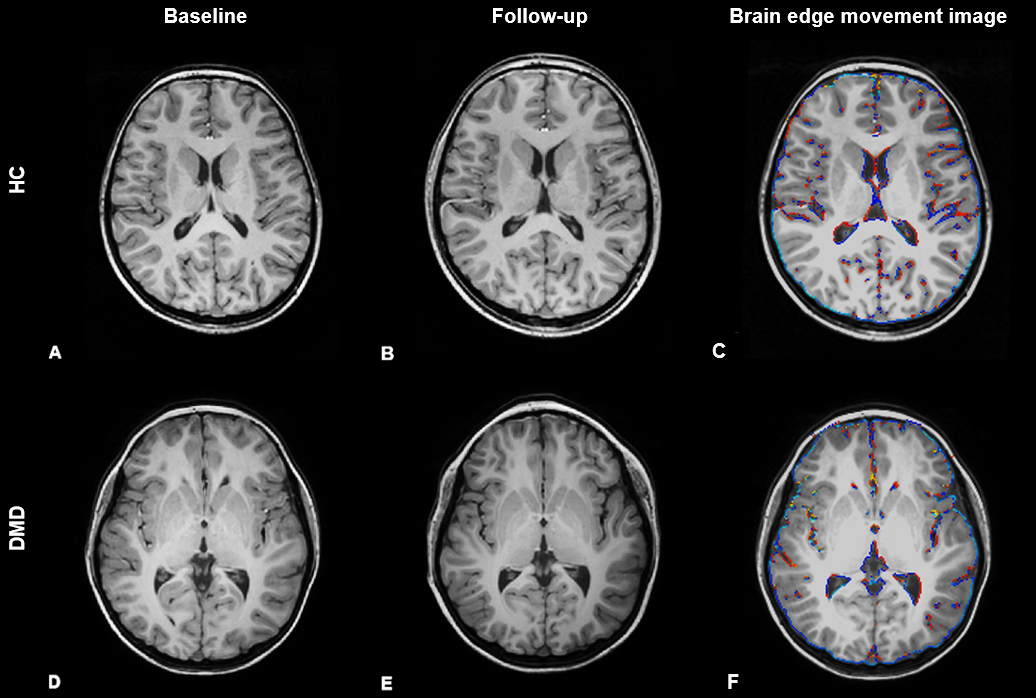
1. Axial slices of an individual participant with DMD and a healthy control.
The first row (A-C) show T1-weighted images of a HC at baseline
(A), follow-up (B) and the corresponding image of changes at the brain edges
superimposed on a interpolated halfway point between baseline and follow-up MR
images (edge-motion image). (C) The bottom row shows T1-weighted images of a participant with DMD, with baseline (D), follow-up (E) and
edge-motion image. The brain edge movement image shows local reductions (in
blue-green) and increases (red-yellow).
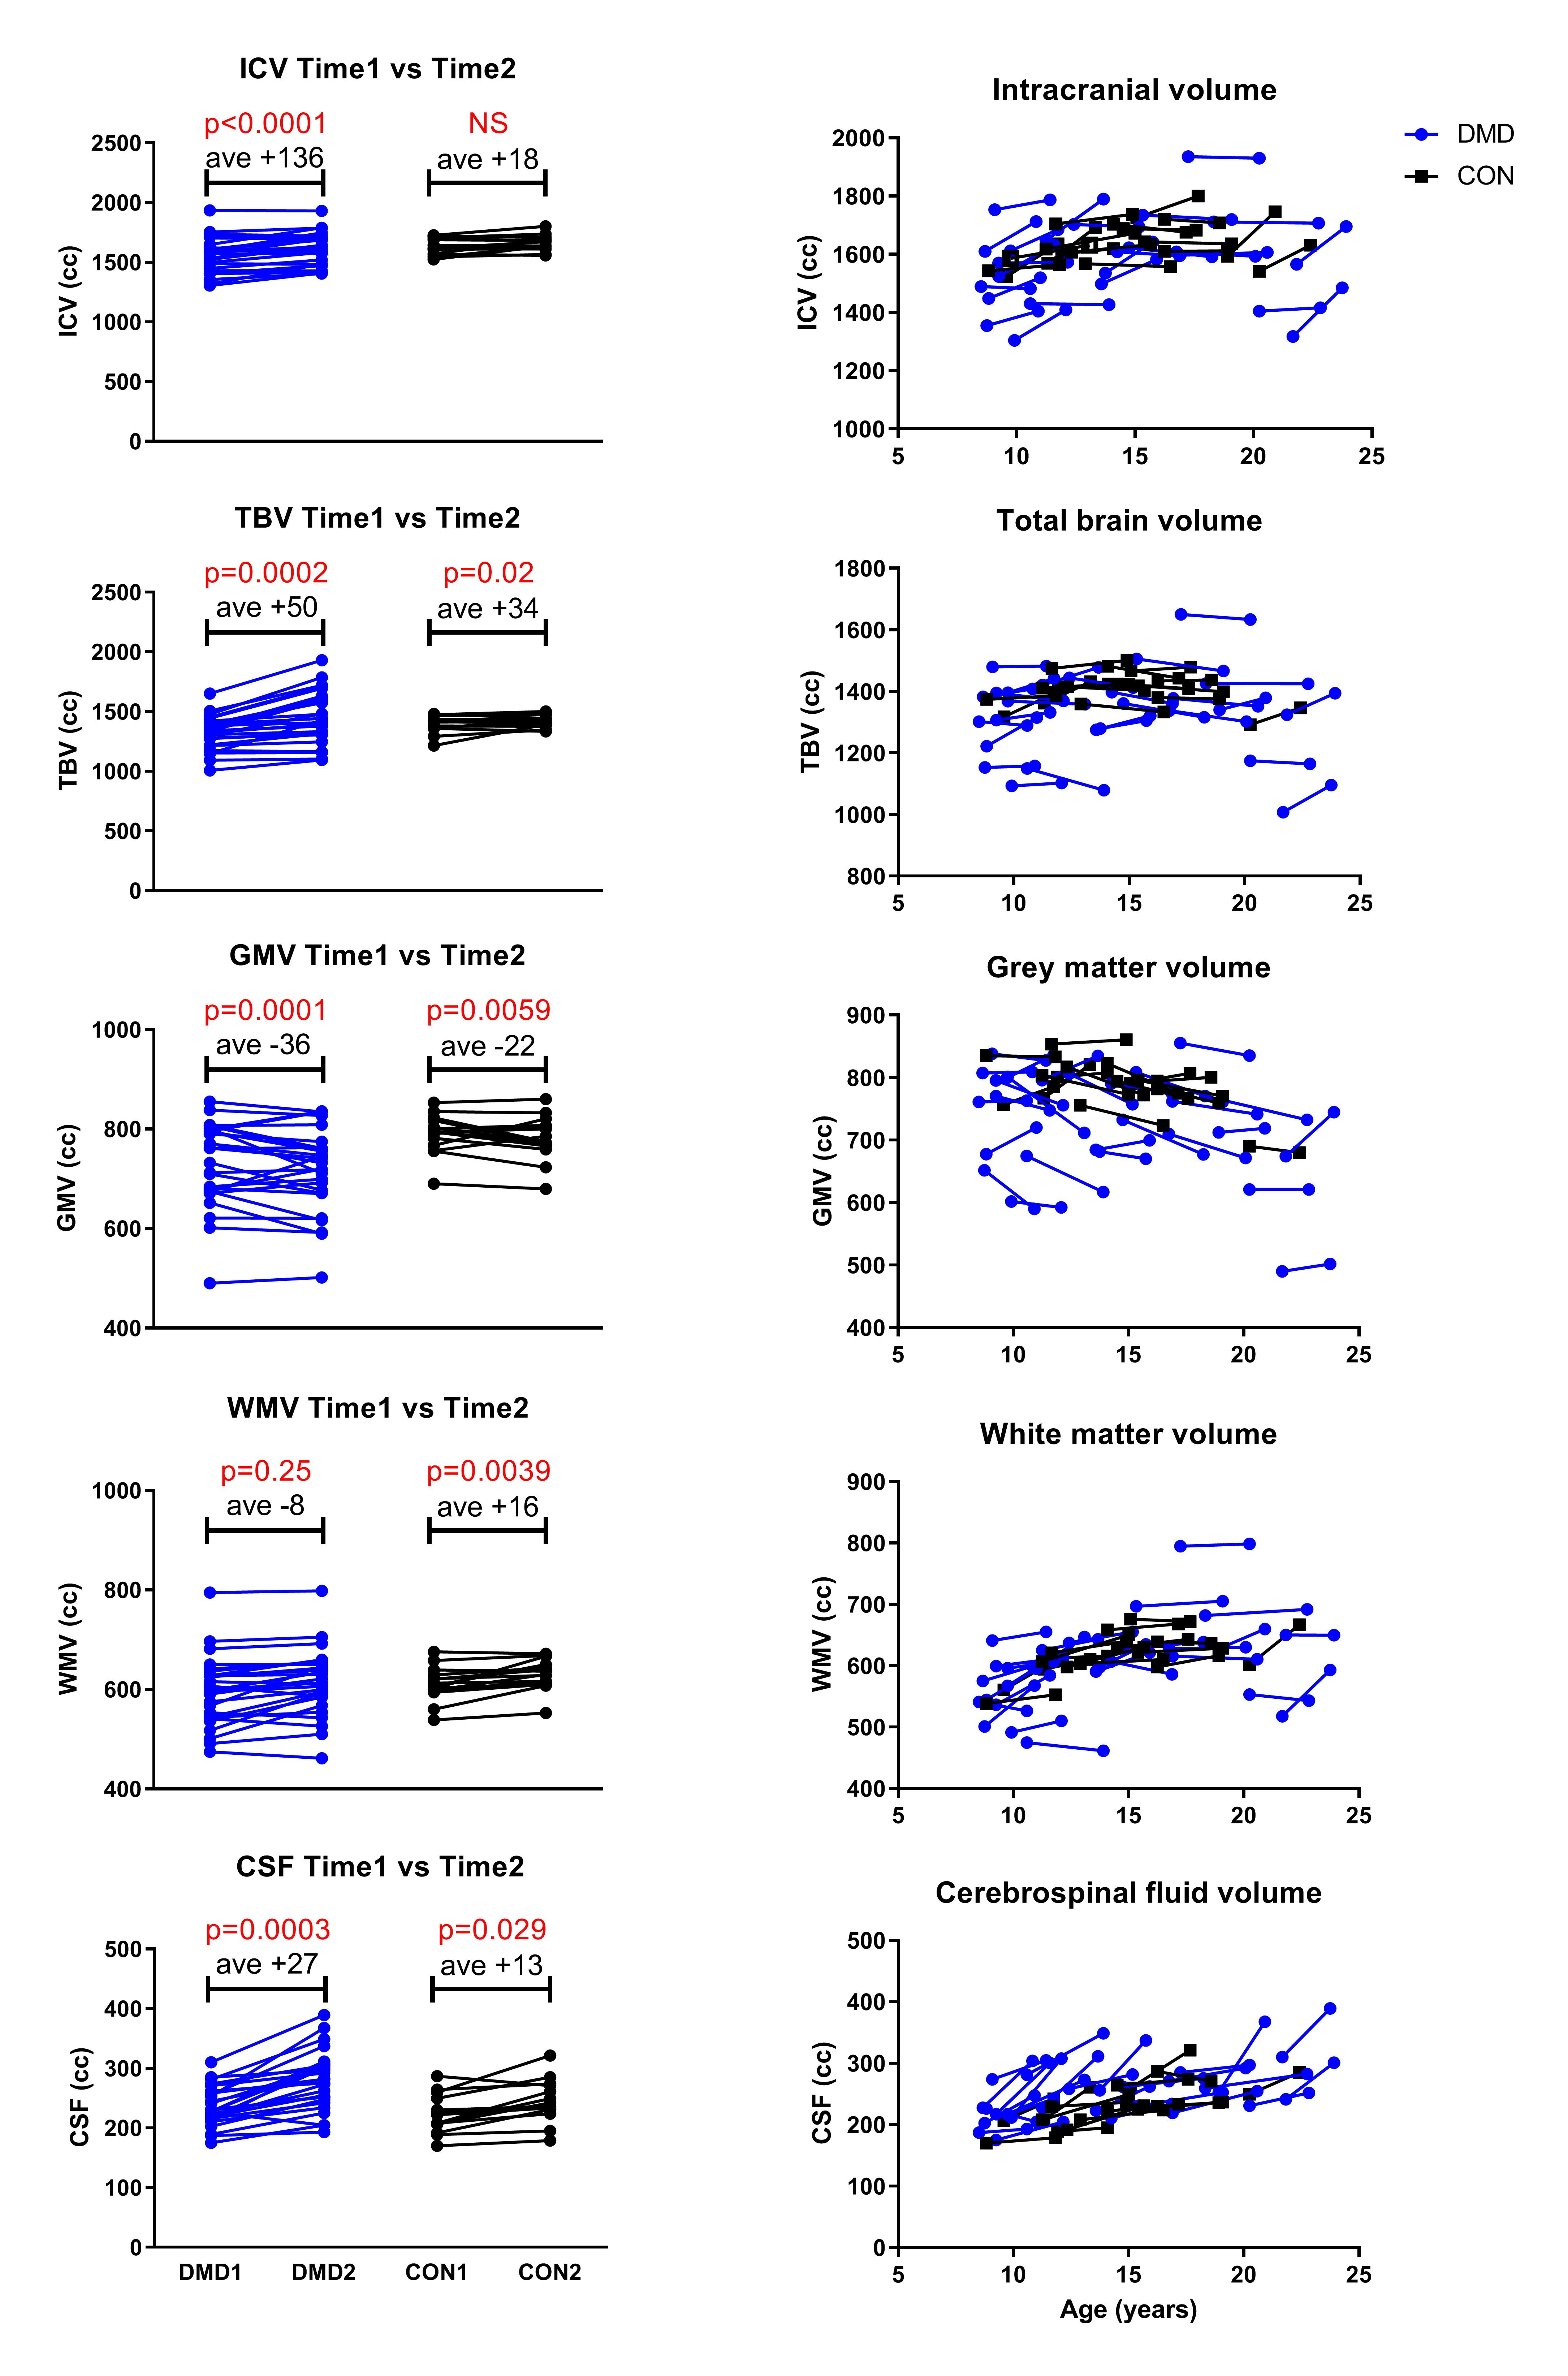
Figure 2. Left top to bottom: results of the
paired t-test between baseline (Time1) and follow-up (Time2) within groups; DMD
in blue, HC in black. Intracranial volume (ICV), total brain volume (TBV), grey
matter volume (GMV), white matter volume (WMV) and cerebrospinal fluid volume
(CSF) with average increase or average decrease over time. Results were
considered significant at Bonferroni corrected p≤0.005. Right
top to bottom: results of the longitudinal mixed model analysis between groups
corrected for age. DMD in blue, HC in black.