Liam S. P. Lawrence1, Rachel W. Chan2, Hanbo Chen3, Brian Keller3, James Stewart3, Mark Ruschin3, Brige Chugh3,4, Mikki Campbell3, Aimee Theriault3, Greg J. Stanisz1,2,5, Scott MacKenzie3, Sten Myrehaug3, Jay Detsky3, Pejman J. Maralani6, Chia-Lin Tseng3, Greg J. Czarnota1,2,3, Arjun Sahgal3, and Angus Z. Lau1,2
1Medical Biophysics, University of Toronto, Toronto, ON, Canada, 2Physical Sciences, Sunnybrook Research Institute, Toronto, ON, Canada, 3Department of Radiation Oncology, Sunnybrook Health Sciences Centre, Toronto, ON, Canada, 4Department of Physics, Ryerson University, Toronto, ON, Canada, 5Department of Neurosurgery and Paediatric Neurosurgery, Medical University of Lublin, Lublin, Poland, 6Department of Medical Imaging, University of Toronto, Sunnybrook Health Sciences Centre, Toronto, ON, Canada
1Medical Biophysics, University of Toronto, Toronto, ON, Canada, 2Physical Sciences, Sunnybrook Research Institute, Toronto, ON, Canada, 3Department of Radiation Oncology, Sunnybrook Health Sciences Centre, Toronto, ON, Canada, 4Department of Physics, Ryerson University, Toronto, ON, Canada, 5Department of Neurosurgery and Paediatric Neurosurgery, Medical University of Lublin, Lublin, Poland, 6Department of Medical Imaging, University of Toronto, Sunnybrook Health Sciences Centre, Toronto, ON, Canada
1.5T MR-Linac measurements of the apparent diffusion coefficient are accurate and sufficiently precise to detect change in glioma; intravoxel incoherent motion blood volume fraction may be biased and insufficiently precise to detect tumour changes.
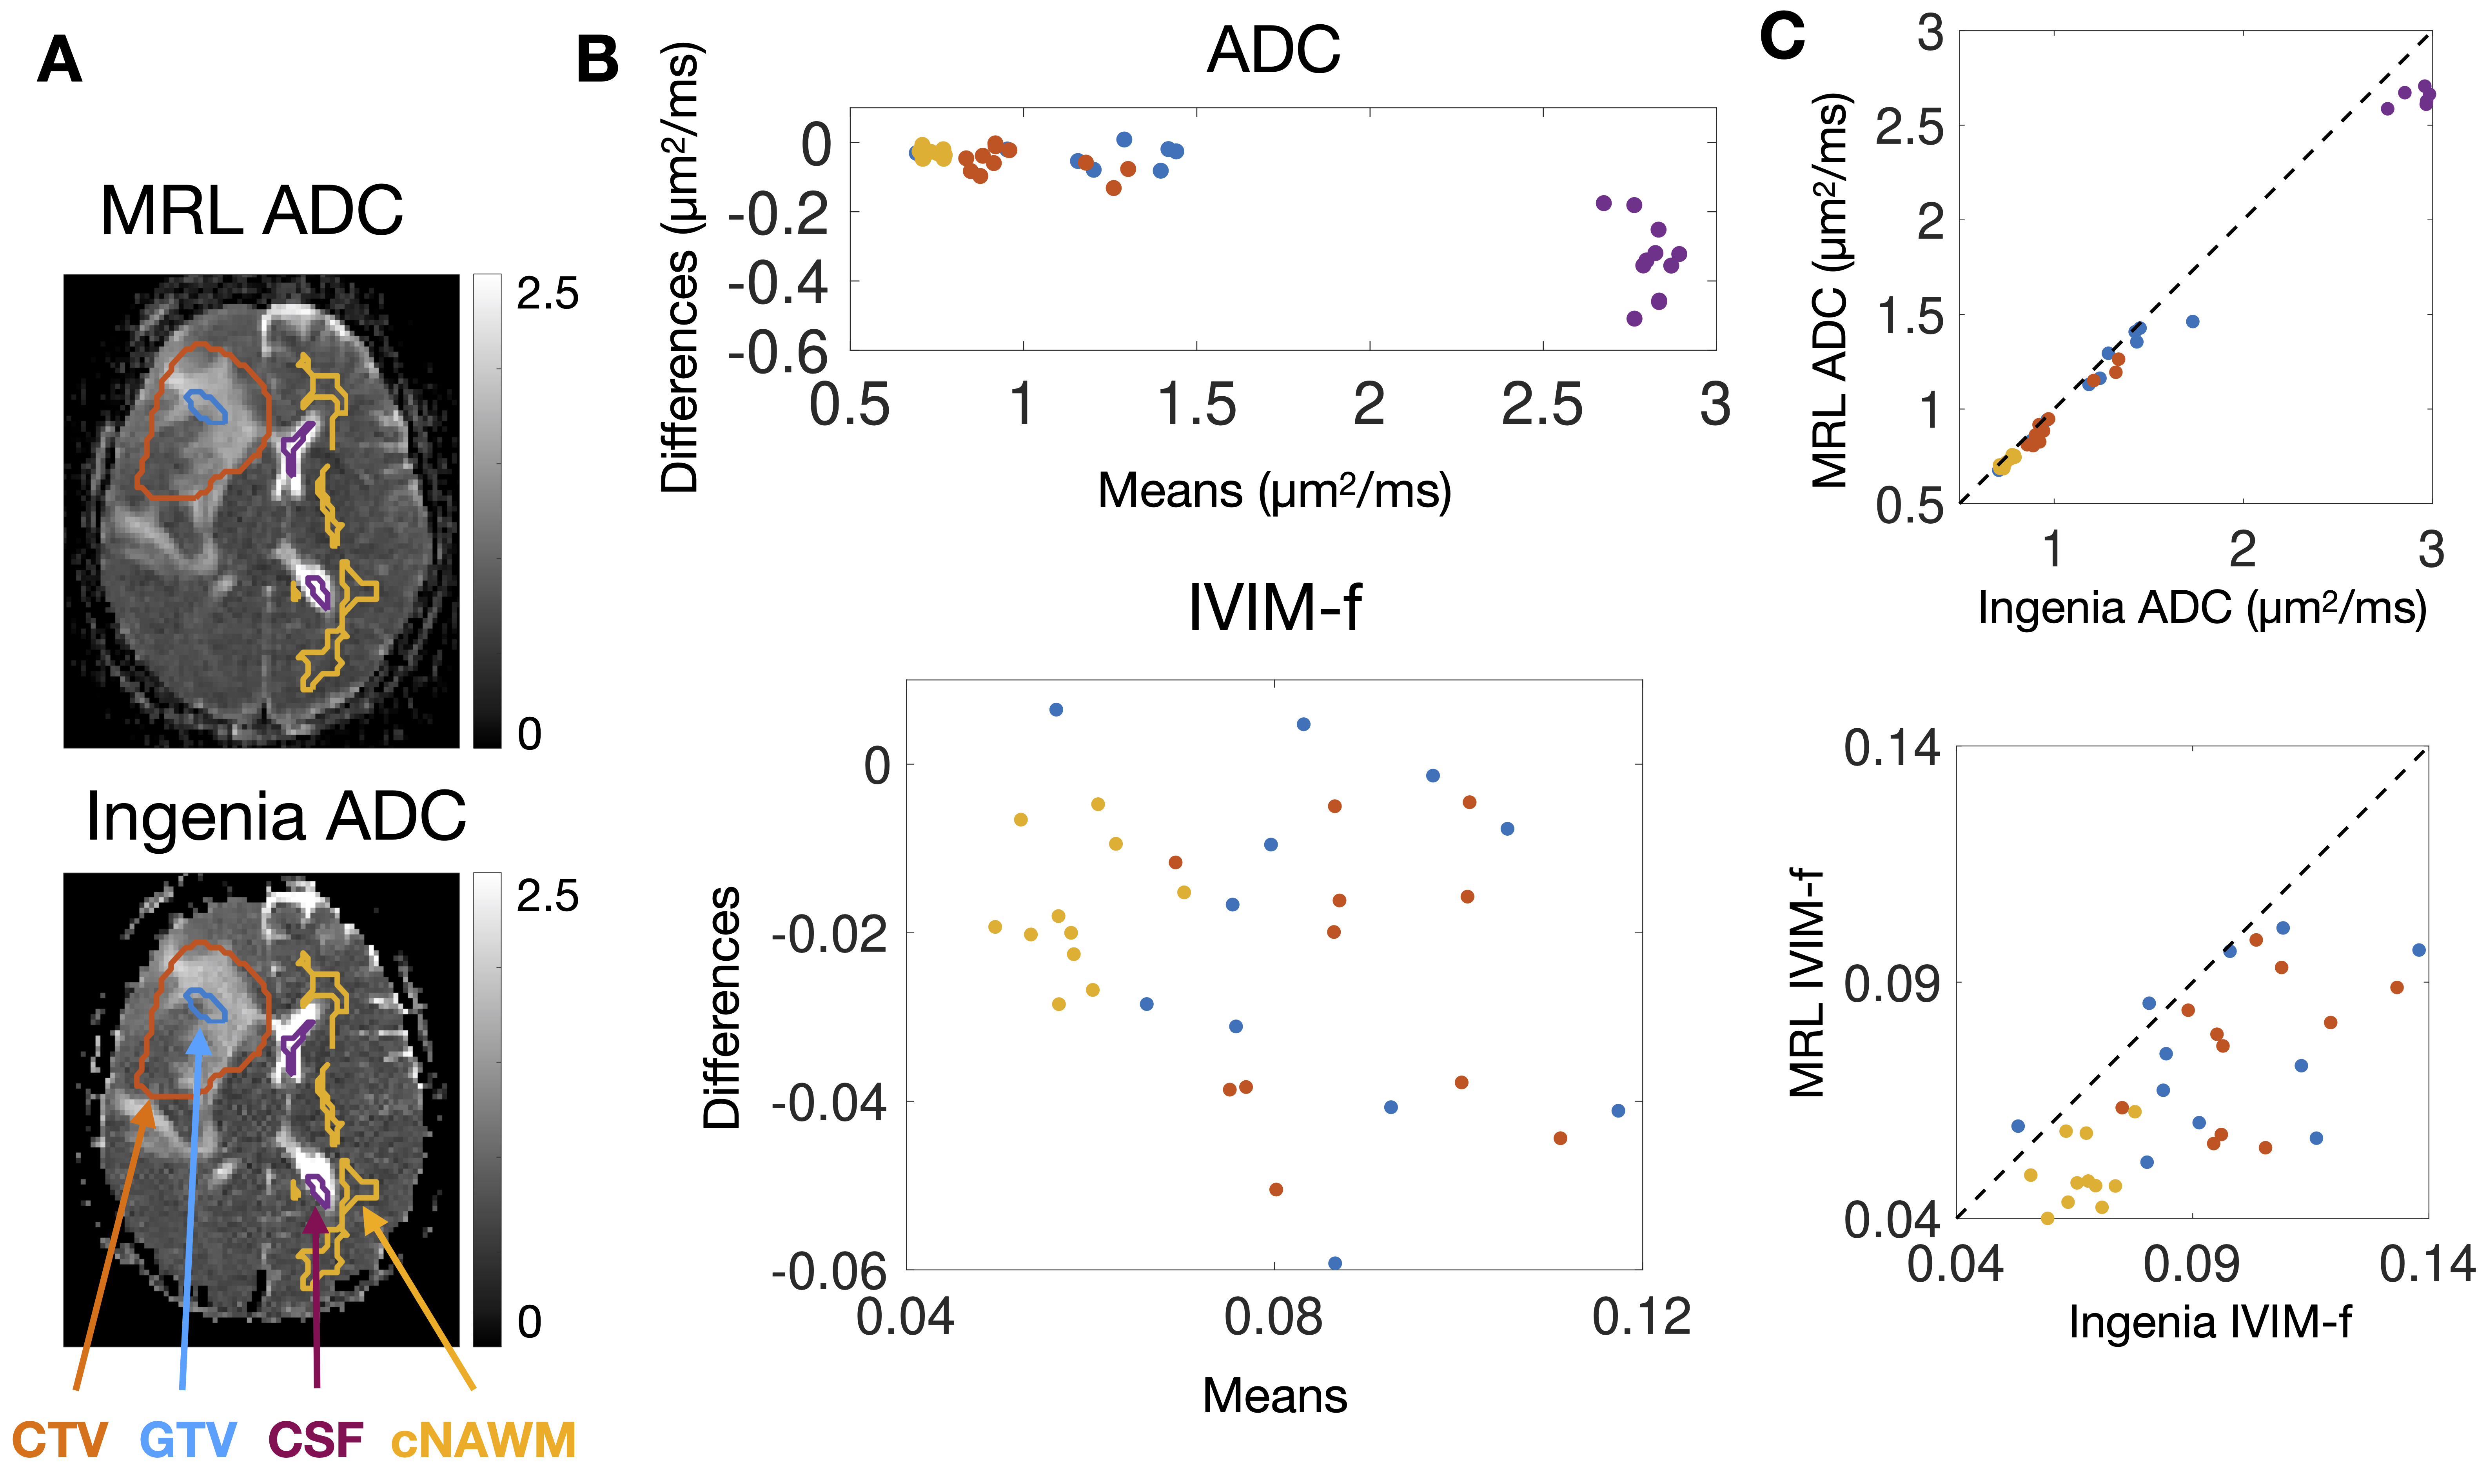
Figure 2 – Bland-Altman plots of median ADC and IVIM-f measured on the MRL versus the Ingenia: (A) shows ADC maps from the MRL and the Ingenia from the same patient on the same day. The contours are the GTV (blue), CTV (orange), cNAWM (yellow), and CSF (purple). Bland-Altman plots of the ADC and IVIM-f are shown in (B), with points coloured by ROI. (C) shows plots of Ingenia versus MRL ADC and IVIM-f.
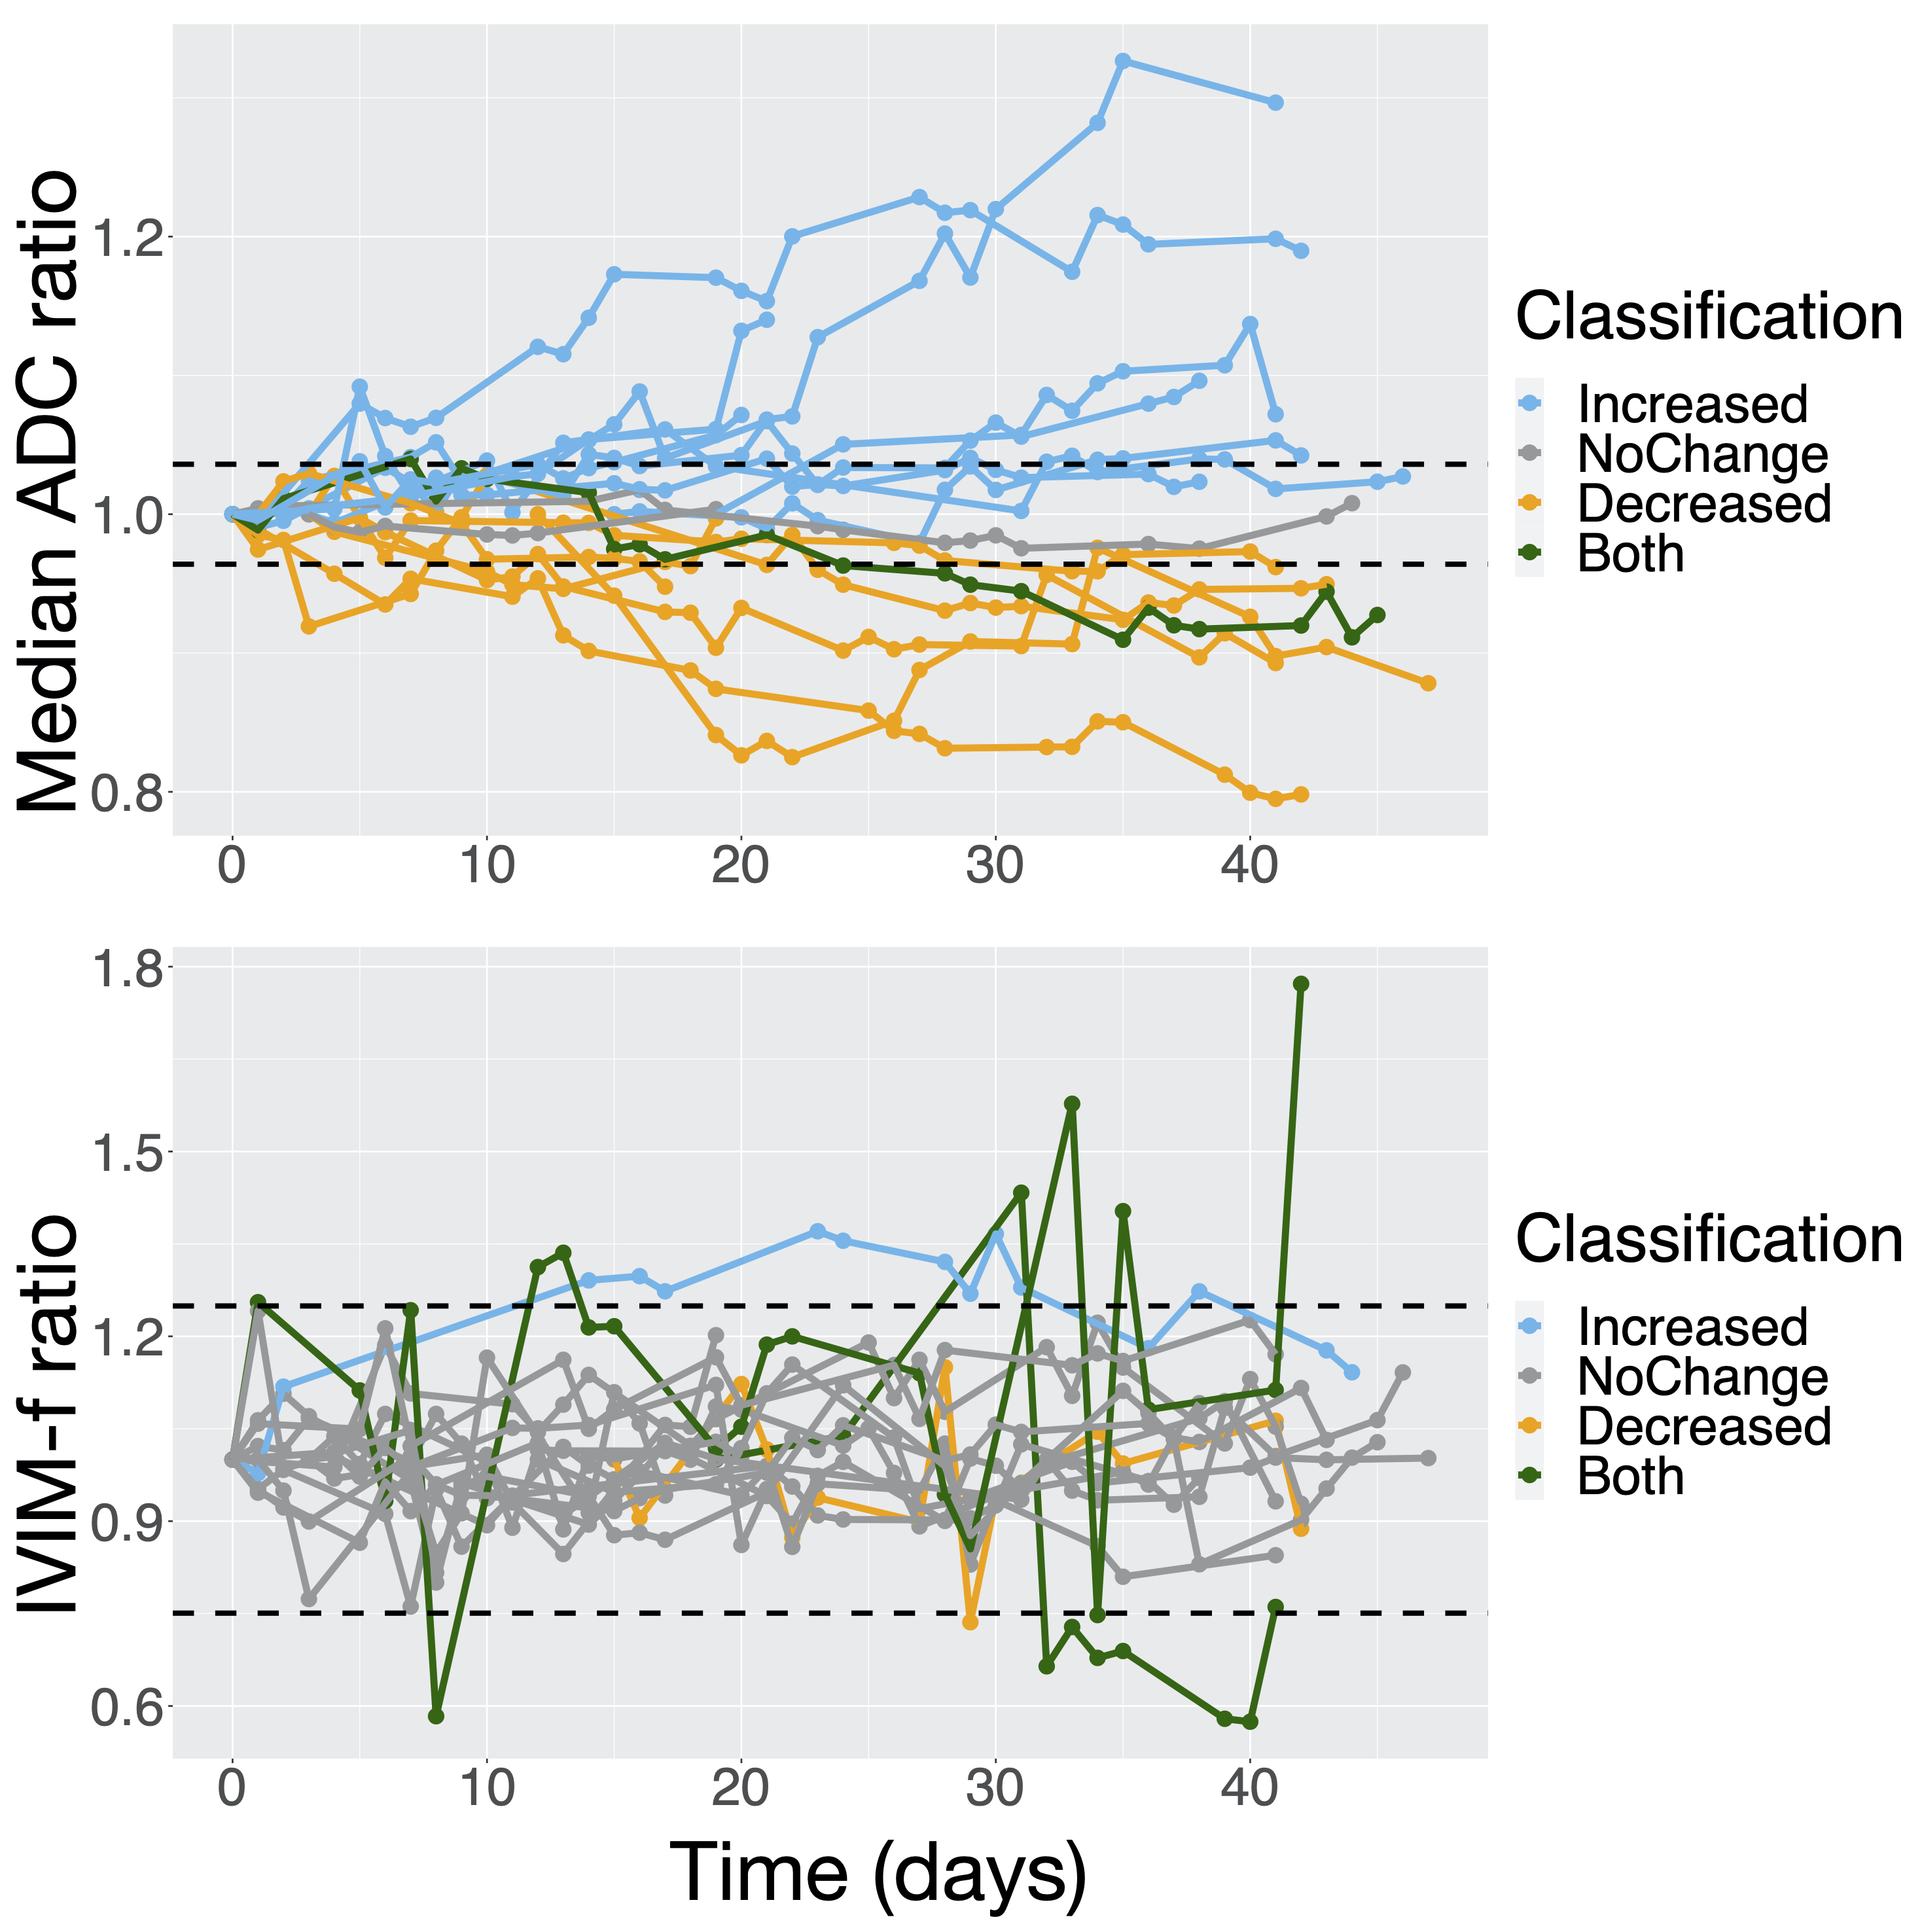
Figure 5 – ADC and IVIM-f measurements in the GTV during radiotherapy: (A) and (B) show the median ADC and IVIM-f ratio (value at a session normalized by baseline value) over the GTV as a function of time from the first fraction. The thresholds for statistically significant change (100% ± $$$\text{%RC}$$$) are shown as dashed lines: the classification is based on whether a change was detected at any session.