Frederick C. Damen1, Alessandro Scotti1, Frederick W. Damen2, Nitu Saran1, Tibor Valyi-Nagy3, Mirko Vukelich1, and Kejia Cai1
1Radiology, University of Illinois at Chicago, Chicago, IL, United States, 2Biomedical Engineering, Purdue University, West Lafayette, IN, United States, 3Pathology, University Of Illinois at Chicago, Chicago, IL, United States
1Radiology, University of Illinois at Chicago, Chicago, IL, United States, 2Biomedical Engineering, Purdue University, West Lafayette, IN, United States, 3Pathology, University Of Illinois at Chicago, Chicago, IL, United States
With accurate and comprehensive fitting of the distributions of
apparent
diffusion for GM and WM, MAD MRI may be
utilized for comprehensively study microstructural changes of brain
under healthy and pathological conditions.
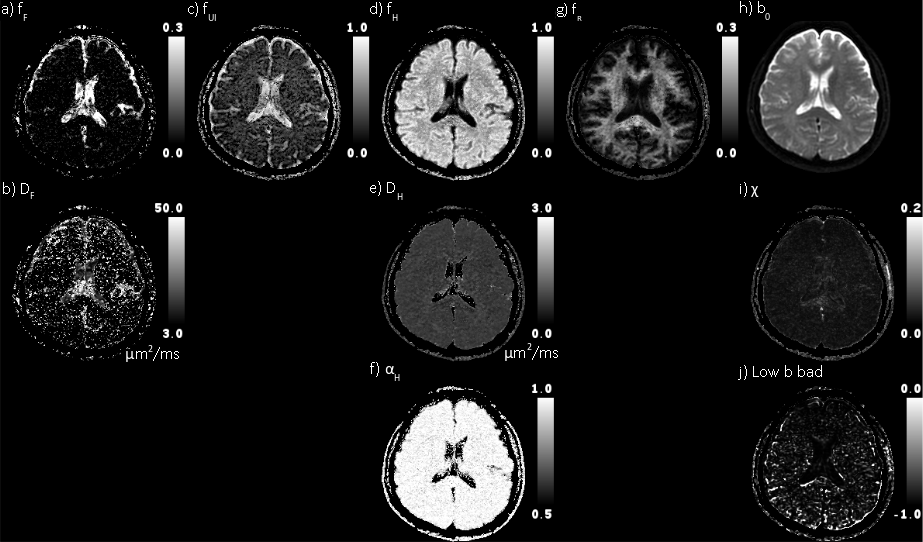
Figure 2 Quad-modal parameter maps. First four columns are flow, and
unimpeded, hindered,
and restricted diffusion, respectively. The top row are
the fractions of the DWI signal explained by each mode of diffusion
(gradient) weighting. The second row is
the pseudo perfusion and diffusivity (μm2/ms). The bottom
row is the stretch exponential shape parameter. The rightmost column
shows the b0 map, χ (rms), and low b bad map
(rxy).
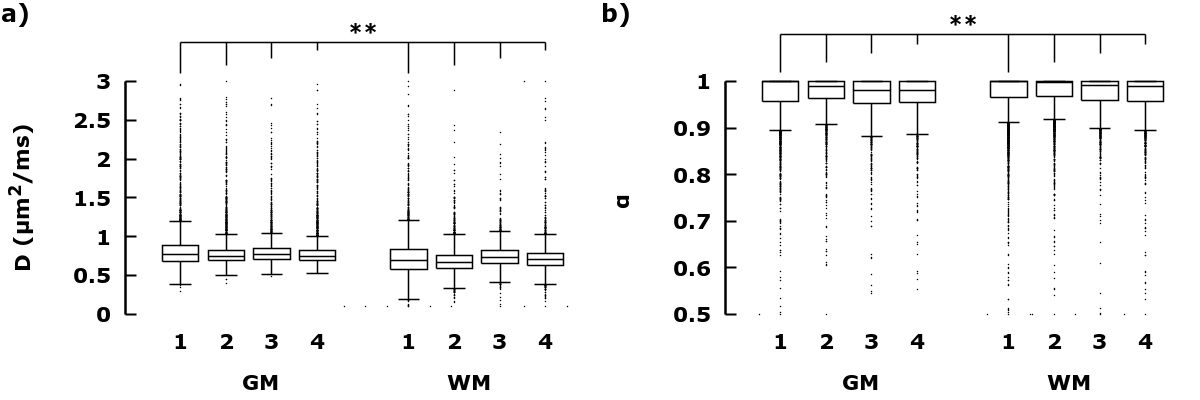
Figure 3 Distribution of Hindered
diffusion in GM vs WM in healthy brains. Boxplots (Gnuplot) of a)
DH, and b) αH, taken from slices comparable to figure 2 in
four healthy subjects. For each subject, each distribution between
GM(fH > 0.8) and WM(fR > 0.1) were statistically different
(Student t-test, P<0.05).