TERESA GERHALTER1, Anna M. Chen1, Seena Dehkharghani1, Rosermary Peralta1, Fatemeh Adlparvar1, James S. Babb1, Tamara Bushnik2, Jonathan M. Silver3, Brian S. Im2, Stephen P. Wall4, Ryan Brown1, Guillaume Madelin1, and Ivan Kirov1
1Center for Biomedical Imaging, Department of Radiology, New York University Grossman School of Medicine, NEW YORK, NY, United States, 2Department of Rehabilitation Medicine, New York University Grossman School of Medicine, NEW YORK, NY, United States, 3Department of Psychiatry, New York University Grossman School of Medicine, NEW YORK, NY, United States, 4Ronald O. Perelman Department of Emergency Medicine, New York University Grossman School of Medicine, NEW YORK, NY, United States
1Center for Biomedical Imaging, Department of Radiology, New York University Grossman School of Medicine, NEW YORK, NY, United States, 2Department of Rehabilitation Medicine, New York University Grossman School of Medicine, NEW YORK, NY, United States, 3Department of Psychiatry, New York University Grossman School of Medicine, NEW YORK, NY, United States, 4Ronald O. Perelman Department of Emergency Medicine, New York University Grossman School of Medicine, NEW YORK, NY, United States
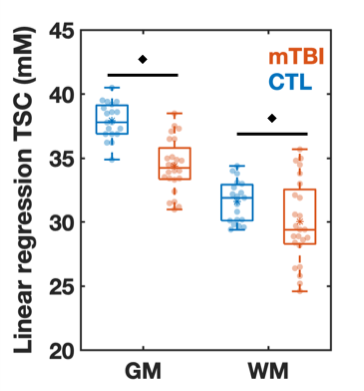
Using linear regression analysis, total sodium concentrations
(TSC) in global white and grey matter were reduced in mild traumatic brain
injury patients (at one month after injury) compared to healthy controls. TSC
correlated with cognitive testing.

Figure
2: Boxplots of TSC in mTBI and control (CTL) from linear regression
analysis. Boxplots show the 1st, 2nd (median),
and 3rd quartiles (box), ±95% (whiskers), and means (*) of the TSC
distributions of the controls and mTBI patients for global grey and white
matter (GM, WM, respectively) using linear regression. The boxplots excluded
the three elder mTBI patients who lacked an age-matched control. Note that TSC
in the GM and WM was decreased in mTBI when compared to controls (age-adjusted
analysis of covariance, ♦: p<0.05).

Table 2: Correlations between clinical and TSC measures. Direct and partial
Spearman correlations (r) and p-values are presented for the association of TSC
with the scores from the Brief Test of Adult Cognition by Telephone (BTACT) and
Rivermead Post-Concussion Symptoms Questionnaire (RPQ) without (direct) and
with (partial) adjustment for the elapsed time from injury to imaging,
respectively. Only statistically
significant correlations are shown (p<0.05).