Marina Y Khodanovich1, Andrey E Akulov2, Tatyana V Anan’ina1, Elena P Krutenkova1, and Anna V Naumova3
1Research Institute of Biology and Biophysics, Tomsk State University, Tomsk, Russian Federation, 2Institute of Cytology and Genetics, Novosibirsk, Russian Federation, 3Radiology, University of Washington, Seattle, WA, United States
1Research Institute of Biology and Biophysics, Tomsk State University, Tomsk, Russian Federation, 2Institute of Cytology and Genetics, Novosibirsk, Russian Federation, 3Radiology, University of Washington, Seattle, WA, United States
Ferritin
and eGFP expression under doublecortin promoter caused 20% decrease in T2* intensity
in the neurogenic (signal comes from the mature and young neurons) and ischemic
(signal from macrophages) zones in the rat brain.
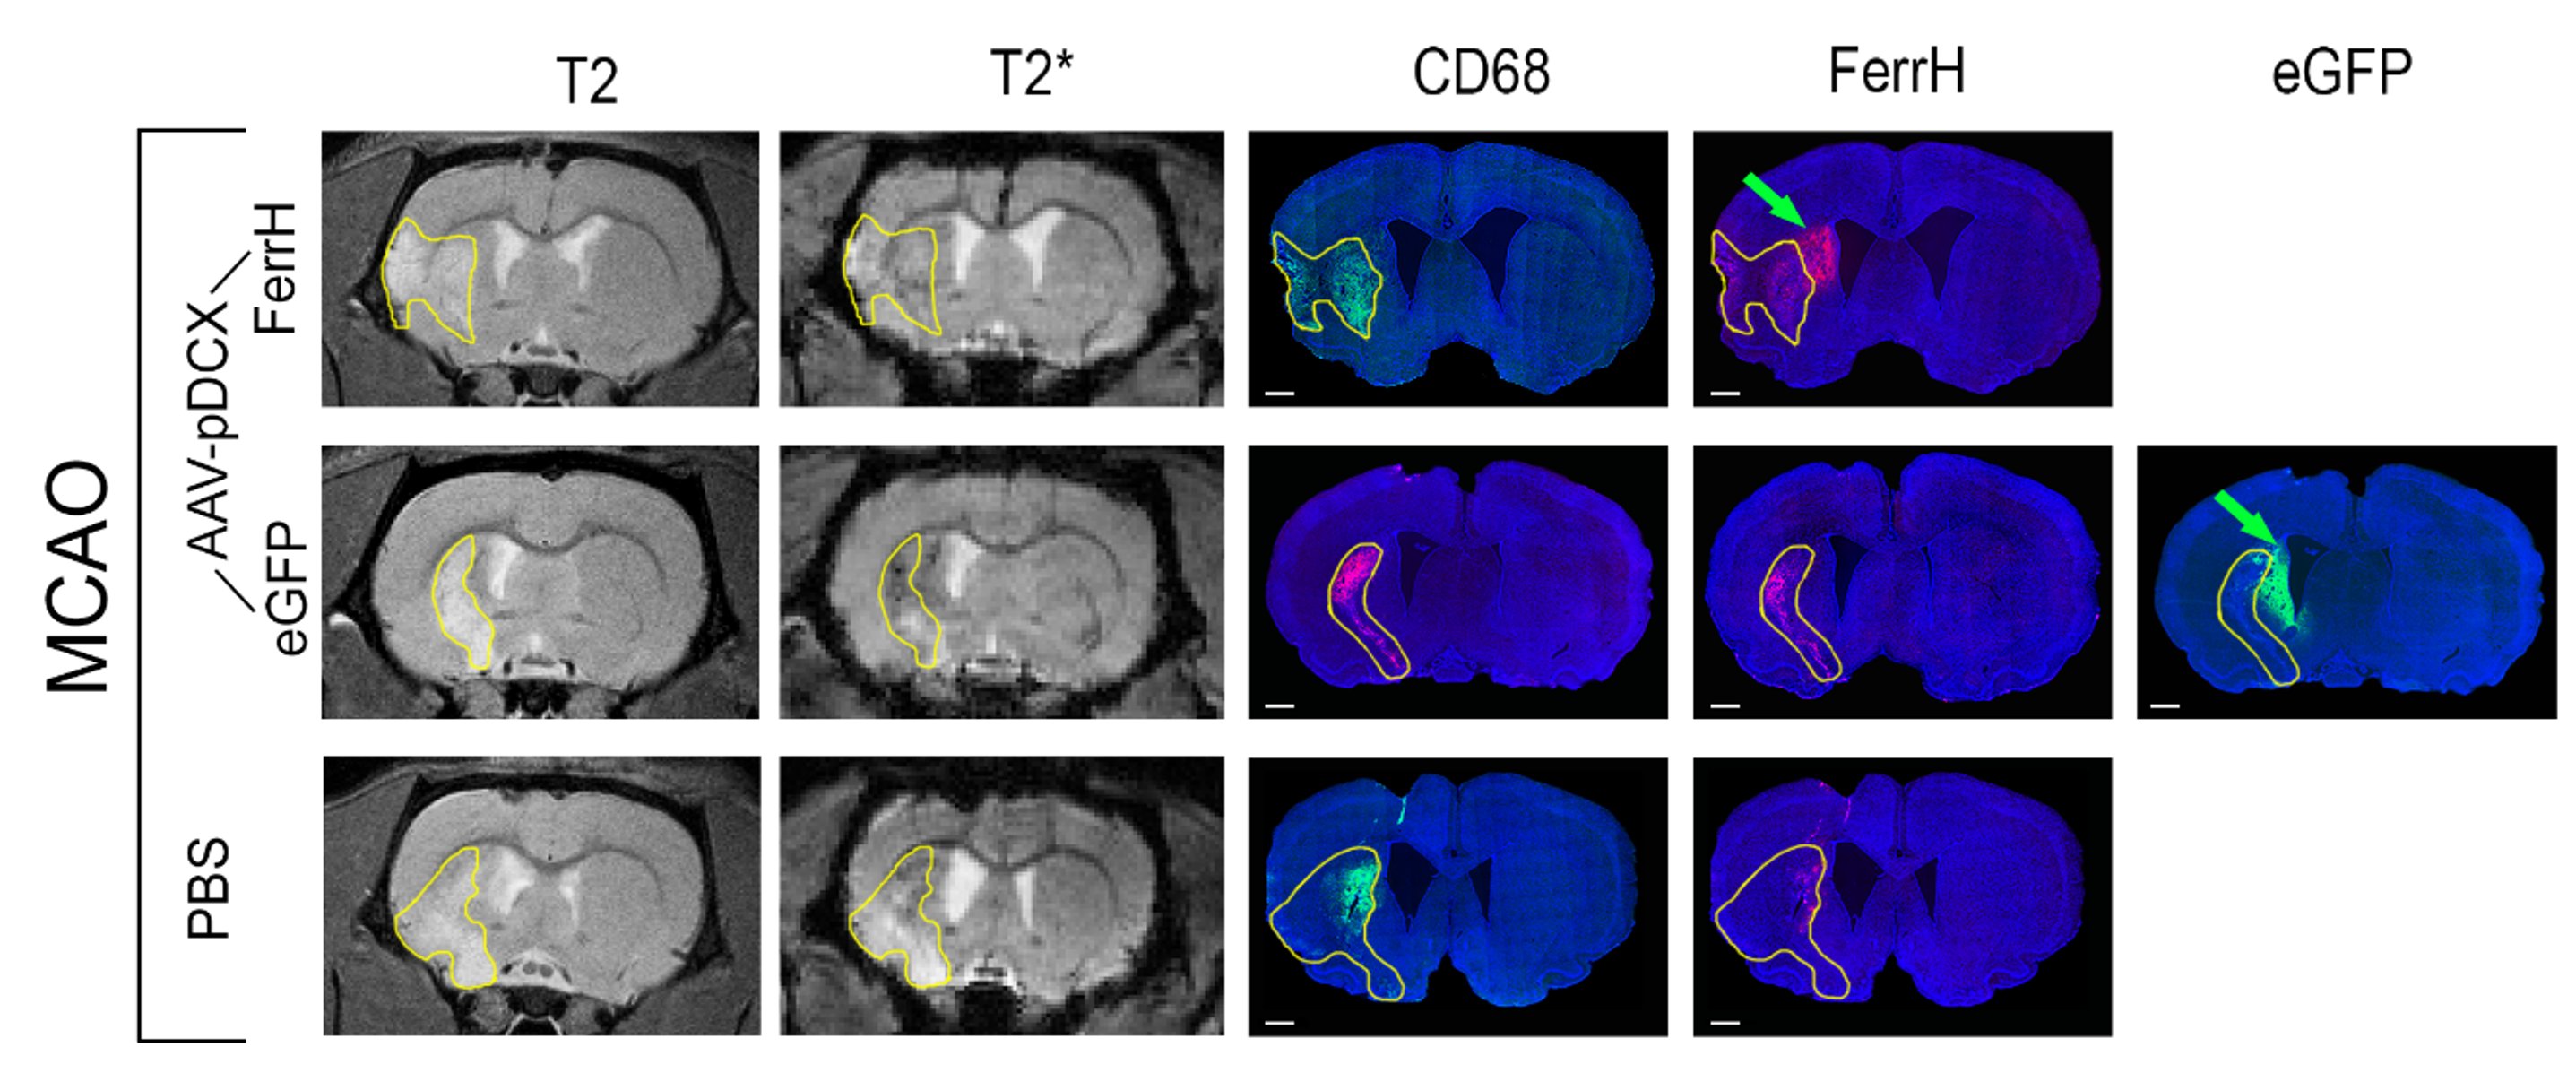
Figure
2. Representative
T2 and T2*-weighted images of the rat brain after MCAO surgery in the day 28
after injection of viral vectors or PBS. Immunofluorescent staining was done for
ferritin (FerrH) and activated microglia/macrophages (CD68). eGFP signal was read at the fluorescent
microscope with a wavelength of 488 nm. Areas of ischemic lesion
were delineated on T2-weighted and propagated to T2*-weighed and to the
histological images. Green arrows point to areas of the transgene expression
near SVZ outside of ischemic lesion.
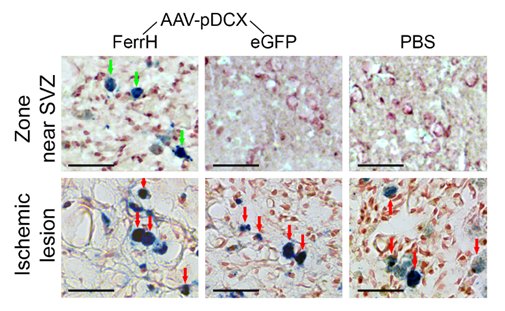
Figure 3. Prussian Blue histological staining
for detection of iron accumulation in the zone near lateral ventricle and SVZ
(top row) and in the ischemic lesion zone (bottom row). Green arrows point to
the cells with iron accumulation in the zone near the SVZ; red arrows point to
the cells with iron accumulation in the ischemic lesion. Scale bar corresponds
to 50 µm.