Shun Kishimoto1, Jeffrey R Brender1, Jeeva Munasinghe2, Martin Lizak2, Yu Saito1, Kota Yamashita1, Otowa Yasunori1, Kazu Yamamoto1, James Mitchell1, and Murali C. Krishna1
1NIH/NCI, Bethesda,, MD, United States, 2NIH/NINDS, Bethesda,, MD, United States
1NIH/NCI, Bethesda,, MD, United States, 2NIH/NINDS, Bethesda,, MD, United States
Glycogen metabolism and glucose utilization in
mice can be followed in brain tissue semi-quantitatively by proton localized
MRS using standard 3T preclinical imaging systems.
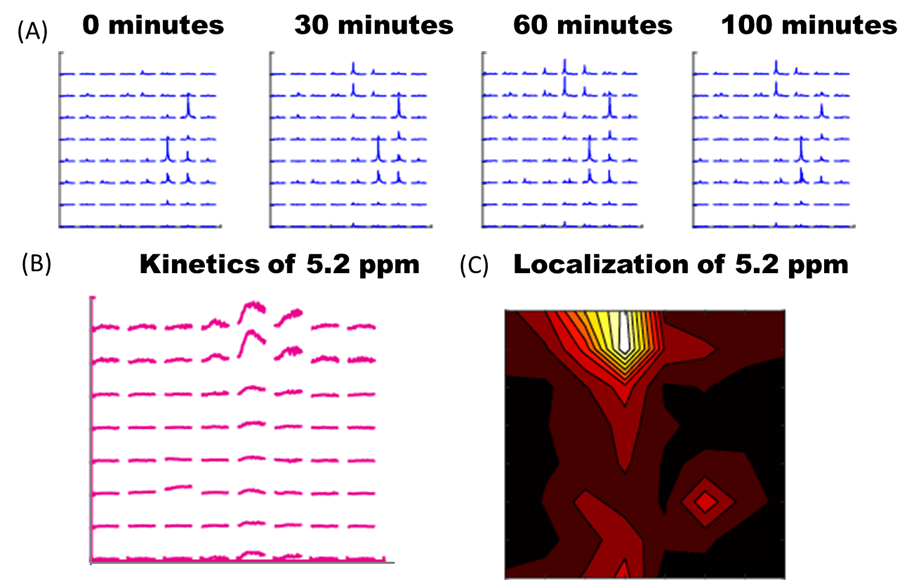
(A)
Time lapse CSI images of a normal mouse brain after the injection of 50 mg
unlabeled glucose. FOV 20 mm x 20 mm x 6 mm, Tr=2 s, 512 spectral FID points. Data
is shown in magnitude mode without averaging. (B) Kinetics of the peak at 5.2
ppm (C) Contour map of the 5.2 ppm peak
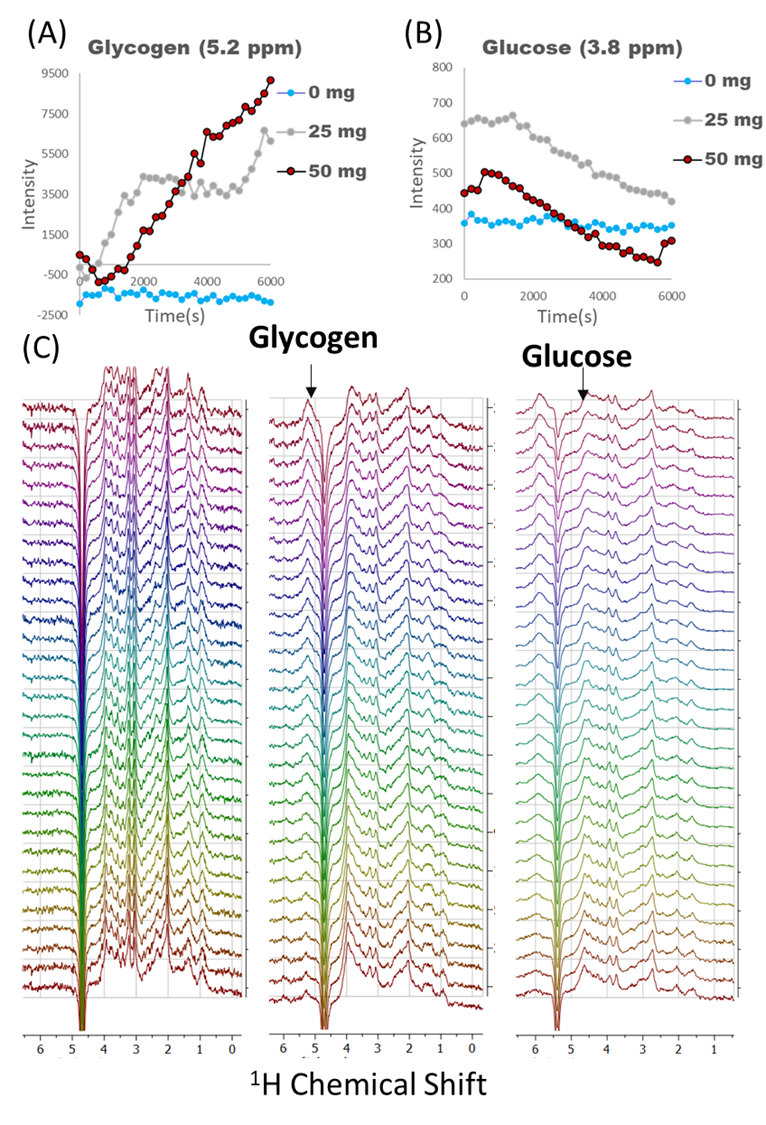
Dose dependence of (A) glycogen and (B) glucose kinetics for
0, 25, and 50 mg doses by following the peaks indicated in (C)