Collin J. Harlan1, Zhan Xu1, Christopher M. Walker1, Keith A. Michel1, Galen D. Reed 2, and James A. Bankson1,3
1Department of Imaging Physics, The University of Texas M.D. Anderson Cancer Center, Houston, TX, United States, 2GE Healthcare, Dallas, TX, United States, 3The University of Texas M.D. Anderson Cancer Center UT Health Graduate School of Biomedical Sciences, Houston, TX, United States
1Department of Imaging Physics, The University of Texas M.D. Anderson Cancer Center, Houston, TX, United States, 2GE Healthcare, Dallas, TX, United States, 3The University of Texas M.D. Anderson Cancer Center UT Health Graduate School of Biomedical Sciences, Houston, TX, United States
B1+ maps for the 13C
clamshell coil were measured by hand. An assessment of the impact of B1+
inhomogeneities on potential biomarkers was conducted to determine acceptable
regions within the 13C clamshell coil where deviations in B1+
field homogeneity result in biomarker error within ±10%.
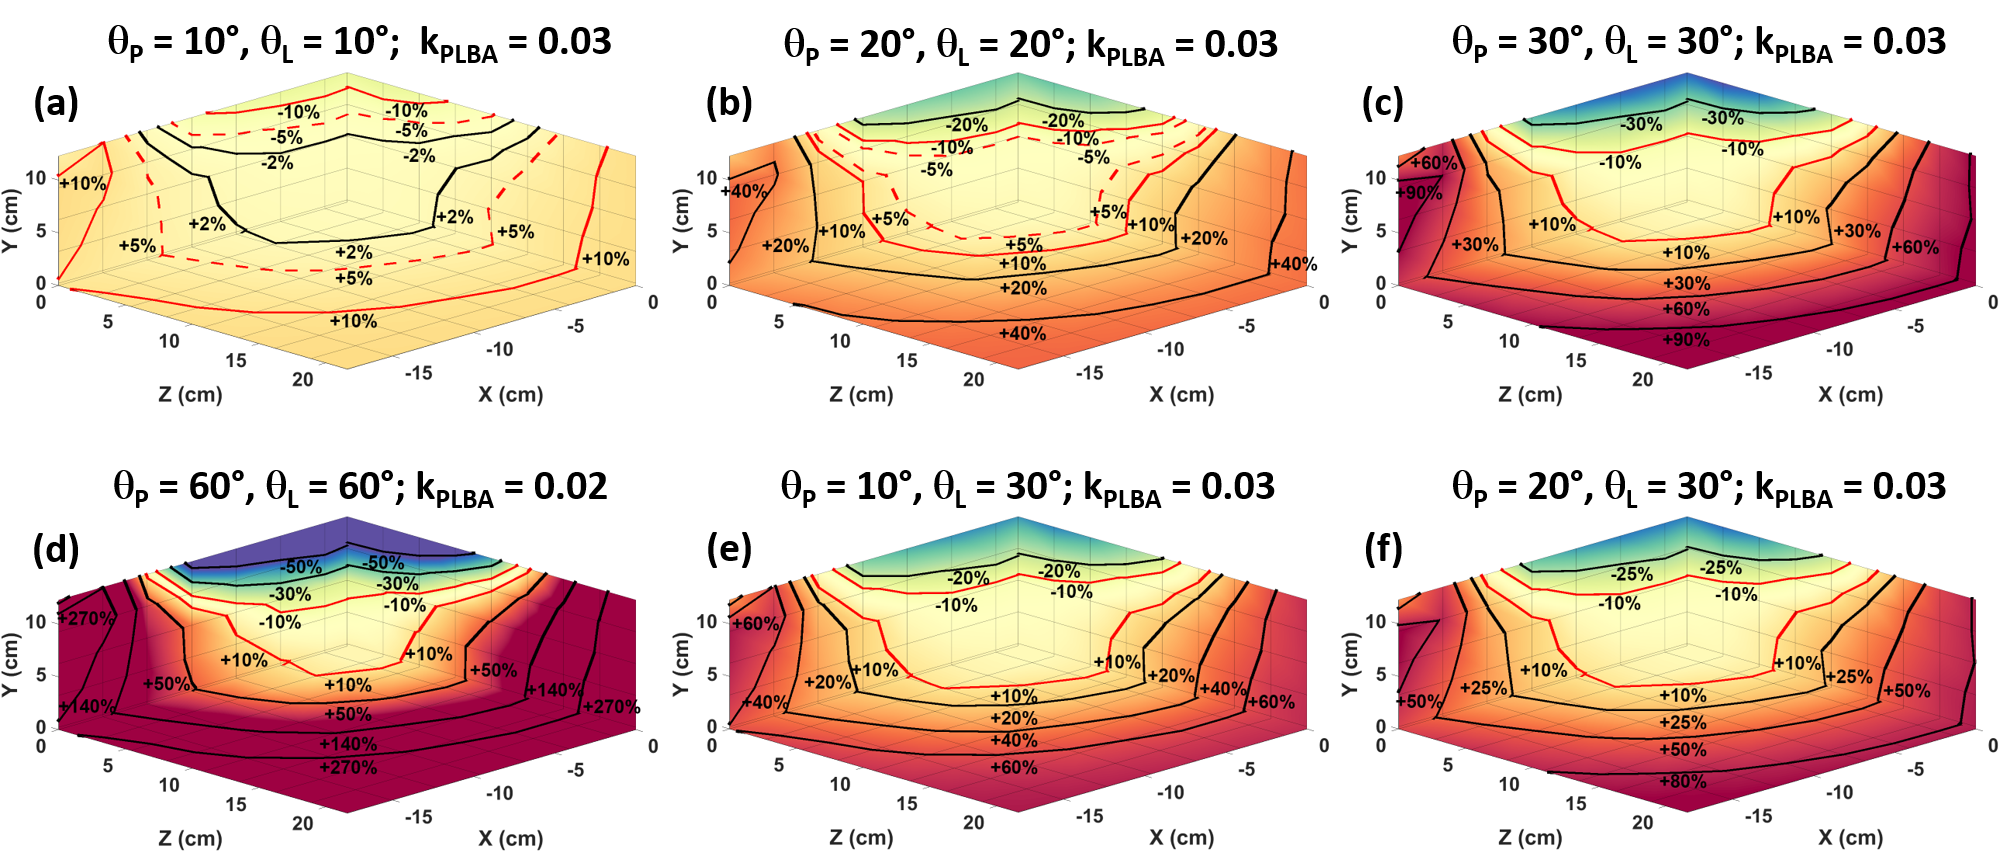
Figure 3. Axial, sagittal, and coronal 3D kPLBA
maps as a function of changes in pyruvate and lactate excitation angle. (a) The
3D kPLBA map for the case when θP = 10°, θL = 10°. (b) The 3D kPLBA
map for the case when θP = 20°, θL = 20°. (c) The 3D kPLBA map for the case when
θP = 30°, θL = 30°. (d) The 3D kPLBA map for the case when
θP = 60°, θL = 60°. (e) The 3D kPLBA map for the case when
θP = 10°, θL = 30°. (f) The 3D kPLBA map for the case when
θP = 20°, θL = 30°.
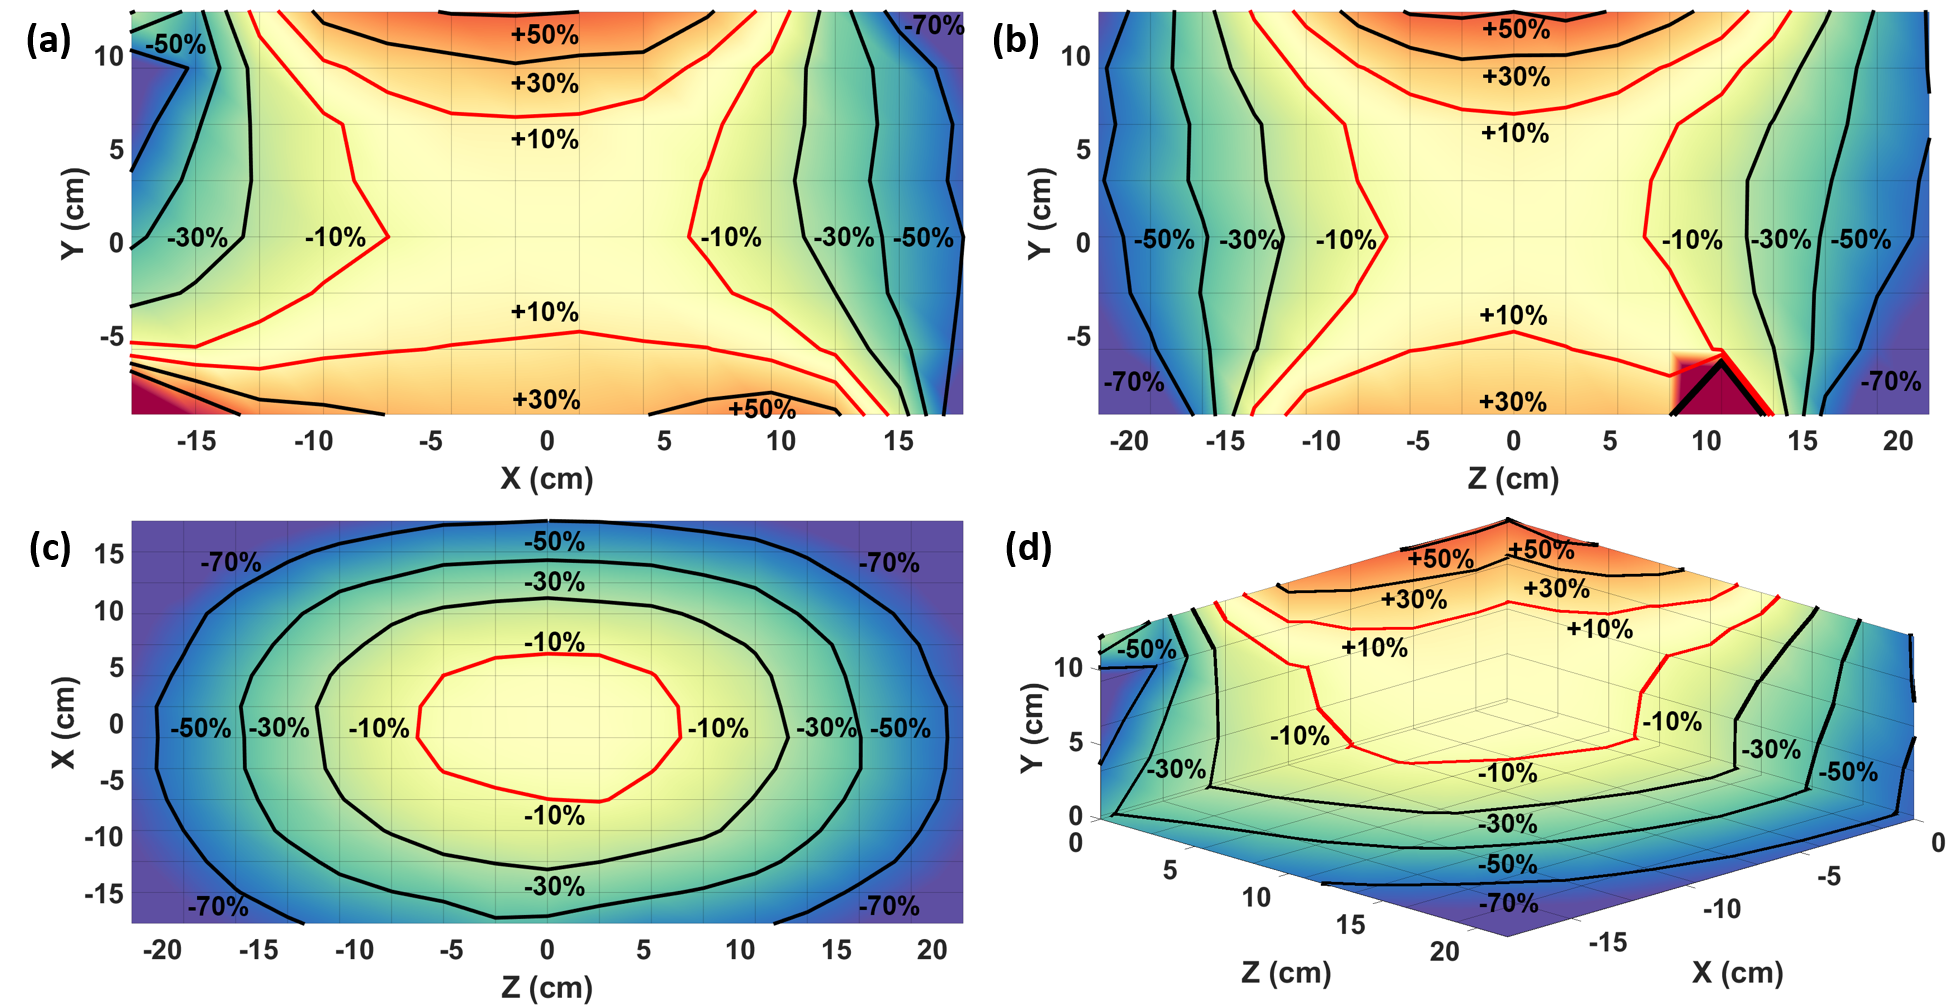
Figure 1. Axial, sagittal, coronal, and multi-plane 3D view of
hand measured B1+ field maps at 13C clamshell
coil isocenter. (a) The axial view of the hand measured B1+
field at coil isocenter. (b) The sagittal view of the hand measured B1+
field at coil isocenter. (c) The coronal view of the hand measured B1+
field at coil isocenter. (d) An axial, sagittal, and coronal multi-plane 3D
quadrant view of the hand measured B1+ field at coil
isocenter. The red contour lines in all subfigures highlight the boundaries of
the volume that produces deviations in the B1+ field
within ±10%.