Sohae Chung1,2, Dmitry S. Novikov1,2, Pippa Storey1,2, and Yvonne W. Lui1,2
1Center for Advanced Imaging Innovation and Research (CAI2R), Department of Radiology, New York University Grossman School of Medicine, New York, NY, United States, 2Bernard and Irene Schwartz Center for Biomedical Imaging, New York University Grossman School of Medicine, New York, NY, United States
1Center for Advanced Imaging Innovation and Research (CAI2R), Department of Radiology, New York University Grossman School of Medicine, New York, NY, United States, 2Bernard and Irene Schwartz Center for Biomedical Imaging, New York University Grossman School of Medicine, New York, NY, United States
The Larmor
frequency variance $$$\delta\Omega^{2}$$$ due to mesoscopic susceptibility variations,
measured from non-monoexponential GRE signal decay, shows potential as an
imaging biomarker for non-heme iron.
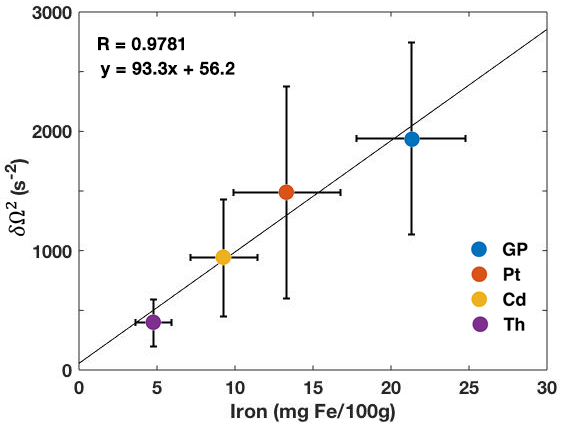
Figure 2:
Average $$$\delta\Omega^{2}$$$ values for four
deep gray nuclei in 26 healthy adults plotted against estimated non-heme iron
concentrations taken from Ref. 7. A highly significant linear correlation supports
the hypothesis that $$$\delta\Omega^{2}$$$ is influenced
by the presence of cellular-level iron. Error bars denote standard deviations.
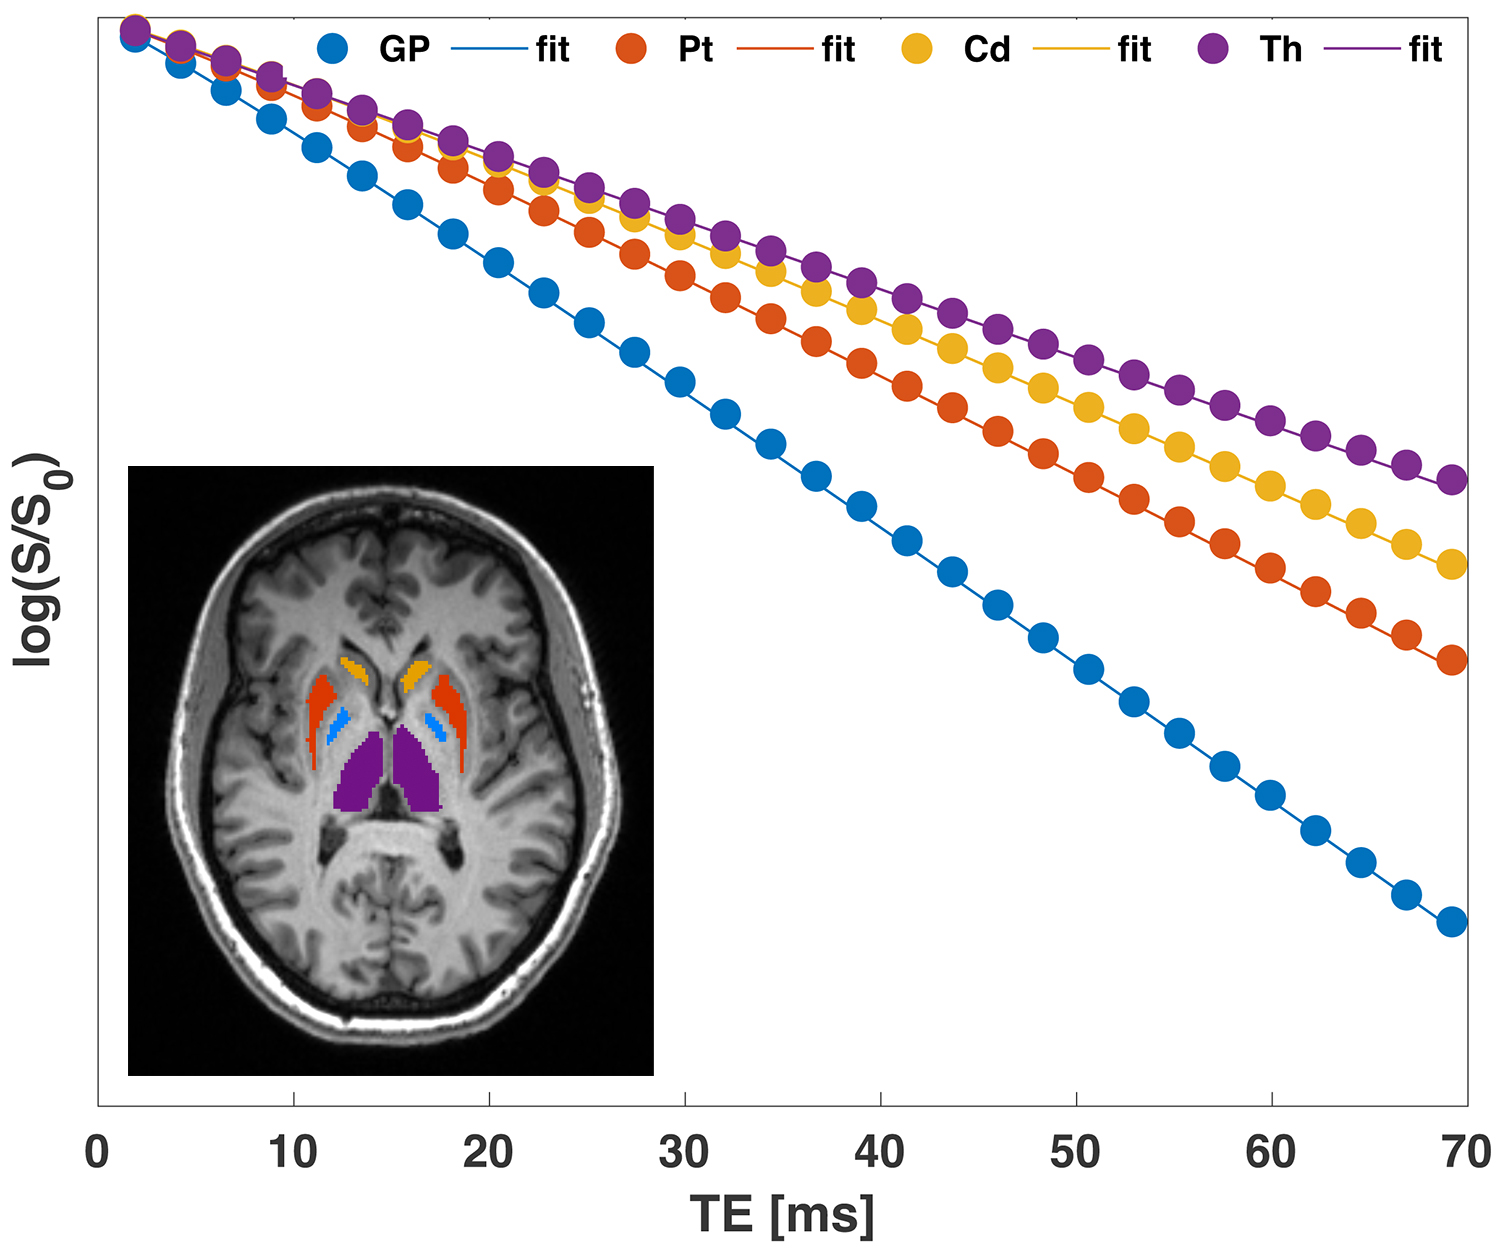
Figure 1:
Signals on a semilog
scale from four ROIs - globus pallidum (GP), putamen (Pt), caudate (Cd) and
thalamus (Th).