Daiki Tamada1, Noriaki Nagata1, Ryoichi Kose2, Katsumi Kose2, Utaroh Motosugi3, and Hiroshi Onishi1
1Department of Radiology, University of Yamanashi, Chuo, Japan, 2MRIsimulations Inc., Tokyo, Japan, 3Department of Radiology, Kofu-Kyoritsu Hospital, Kofu, Japan
1Department of Radiology, University of Yamanashi, Chuo, Japan, 2MRIsimulations Inc., Tokyo, Japan, 3Department of Radiology, Kofu-Kyoritsu Hospital, Kofu, Japan
A method
to simulate T2* shortening by the susceptibility of fat in the liver using FEM
and a simple model was developed.
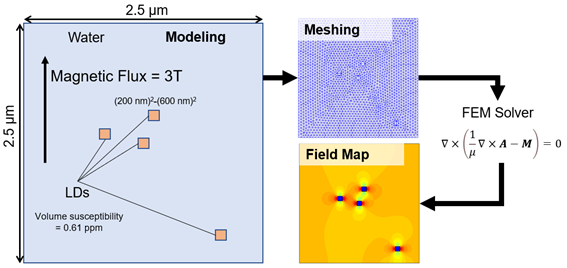
Figure
1: Microscopic field
inhomogeneity was simulated using FEM with a simple model consists of water and
LDs. A rectangular LDs were randomly placed in the water region with (2.5 mm)2.
The susceptibility of triglycerides of 0.61 ppm was used. Different sizes ((200
nm)2-(600 nm)2) of LD were assumed for the modeling. After
meshing the model, the field map was calculated using FEM.
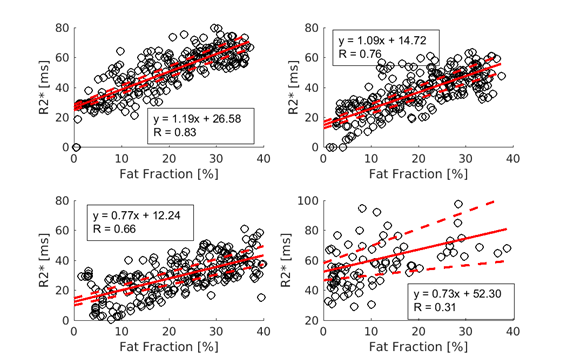
Figure
3: R2* values were
plotted fat fraction with LD size of (a) (200 nm)2, (b) (400 nm)2,
and (c) (600 nm)2, respectively. The slopes of the linear regression for the plots with LD
size of (200 nm)2, (400 nm)2, (600 nm)2 were
1.20 (95% CI = 1.11-1.29), 0.931 (95% CI = 0.841-1.01), and 0.761 (95% CI =
0.67-0.85) while the intercepts for them were 18.2 (95% CI = 16.3-20.1), 10.1
(95% CI = 8.20-11.9), and 5.81 (95% CI = 3.60-8.02), respectively. The
simulation results fairly agreed with (d) in vivo measurement.