Bashair Alhummiany1, David Shelley1,2, Margaret Saysell1,2, Maria-Alexandra Olaru3, Bernd Kühn3, David L. Buckley1, Julie Bailey2, Michael Mansfield2, Steven Sourbron4, and Kanishka Sharma4
1Department of Biomedical Imaging Sciences, University of Leeds, Leeds, United Kingdom, 2Leeds Teaching Hospitals, NHS Trust, Leeds, United Kingdom, 3Siemens Healthcare GmbH, Erlangen, Germany, 4Department of Imaging, Infection, Immunity and Cardiovascular Disease, The University of Sheffield, Sheffield, United Kingdom
1Department of Biomedical Imaging Sciences, University of Leeds, Leeds, United Kingdom, 2Leeds Teaching Hospitals, NHS Trust, Leeds, United Kingdom, 3Siemens Healthcare GmbH, Erlangen, Germany, 4Department of Imaging, Infection, Immunity and Cardiovascular Disease, The University of Sheffield, Sheffield, United Kingdom
Renal blood flow (RBF) from PC, ASL and DCE agreed well on average but agreement on the single-subject level is poor. Further optimization is required before renal perfusion measurements can be used in patient management
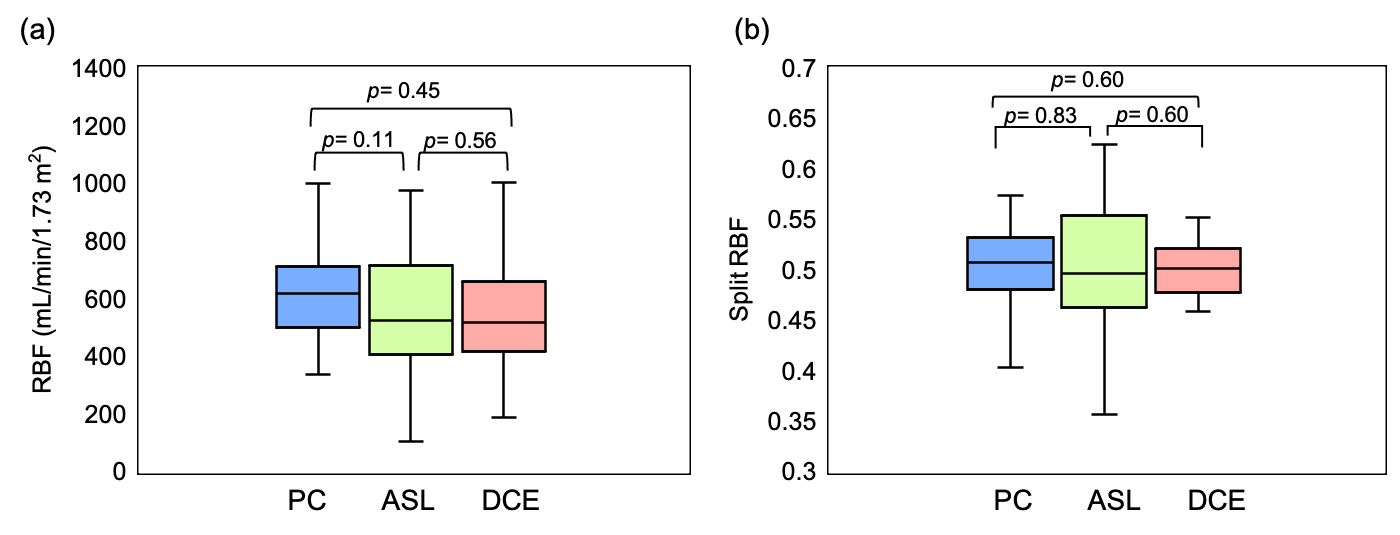
Figure 2 Box and whisker plots depicting distribution of RBF (a) and split-RBF (b) measured with PC-MRI, ASL and DCE-MRI. The p-values for pairwise comparisons of means are given above the plots.
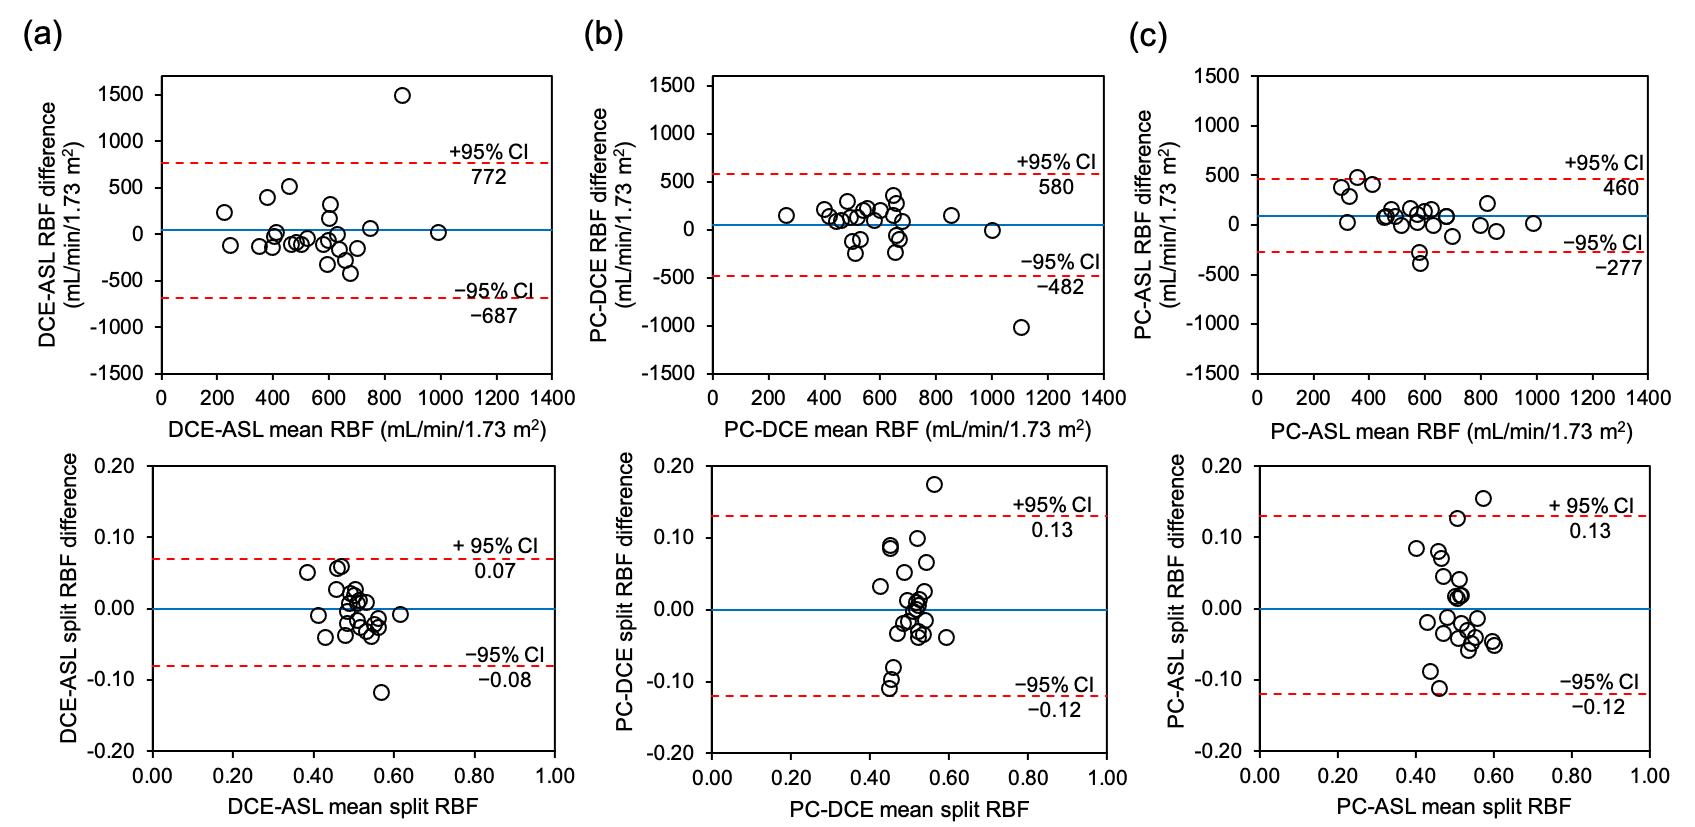
Figure 3 Bland-Altman plots comparing DCE-ASL (a), PC-DCE (b) and PC-ASL (c) for RBF (top panel) and split-RBF (bottom panel). Dashed lines indicate upper and lower 95% confidence intervals (CI) calculated as: mean difference ± 1.96 (SD). Solid lines represent the mean difference between two techniques.