Ke Fang1, Zejun Wang2,3, Zhaoqing Li2,3, Bao Wang4, Guangxu Han2,3, Zhaowei Cheng1, Zhihong Chen1, Chuanjin Lan5, Yi Zhang6, Peng Zhao7, Xinyu Jin1, Yingchao Liu8, and Ruiliang Bai2,3
1College of Information Science & Electronic Engineering, Zhejiang University, Hangzhou, China, 2Department of Physical Medicine and Rehabilitation of The Affiliated Sir Run Run Shaw Hospital AND Interdisciplinary Institute of Neuroscience and Technology, School of Medicine, Zhejiang University, Hangzhou, China, 3Key Laboratory of Biomedical Engineering of Ministry of Education, College of Biomedical Engineering and Instrument Science, Zhejiang University, Hangzhou, China, 4Department of Radiology, Qilu Hospital of Shandong University, Jinan, China, 5School of Medicine, Shandong University, Jinan, China, 6Shandong Medical Imaging Research Institute, Shandong University, Jinan, China, 7Department of Neurosurgery, Provincial Hospital Affiliated to Shandong First Medical University, Jinan, China, 8Provincial Hospital Affiliated to Shandong First Medical University, Jinan, China
1College of Information Science & Electronic Engineering, Zhejiang University, Hangzhou, China, 2Department of Physical Medicine and Rehabilitation of The Affiliated Sir Run Run Shaw Hospital AND Interdisciplinary Institute of Neuroscience and Technology, School of Medicine, Zhejiang University, Hangzhou, China, 3Key Laboratory of Biomedical Engineering of Ministry of Education, College of Biomedical Engineering and Instrument Science, Zhejiang University, Hangzhou, China, 4Department of Radiology, Qilu Hospital of Shandong University, Jinan, China, 5School of Medicine, Shandong University, Jinan, China, 6Shandong Medical Imaging Research Institute, Shandong University, Jinan, China, 7Department of Neurosurgery, Provincial Hospital Affiliated to Shandong First Medical University, Jinan, China, 8Provincial Hospital Affiliated to Shandong First Medical University, Jinan, China
We demonstrated the feasibility of CNN in fastening the computation
of non-linear pharmacokinetic models in DCE-MRI.
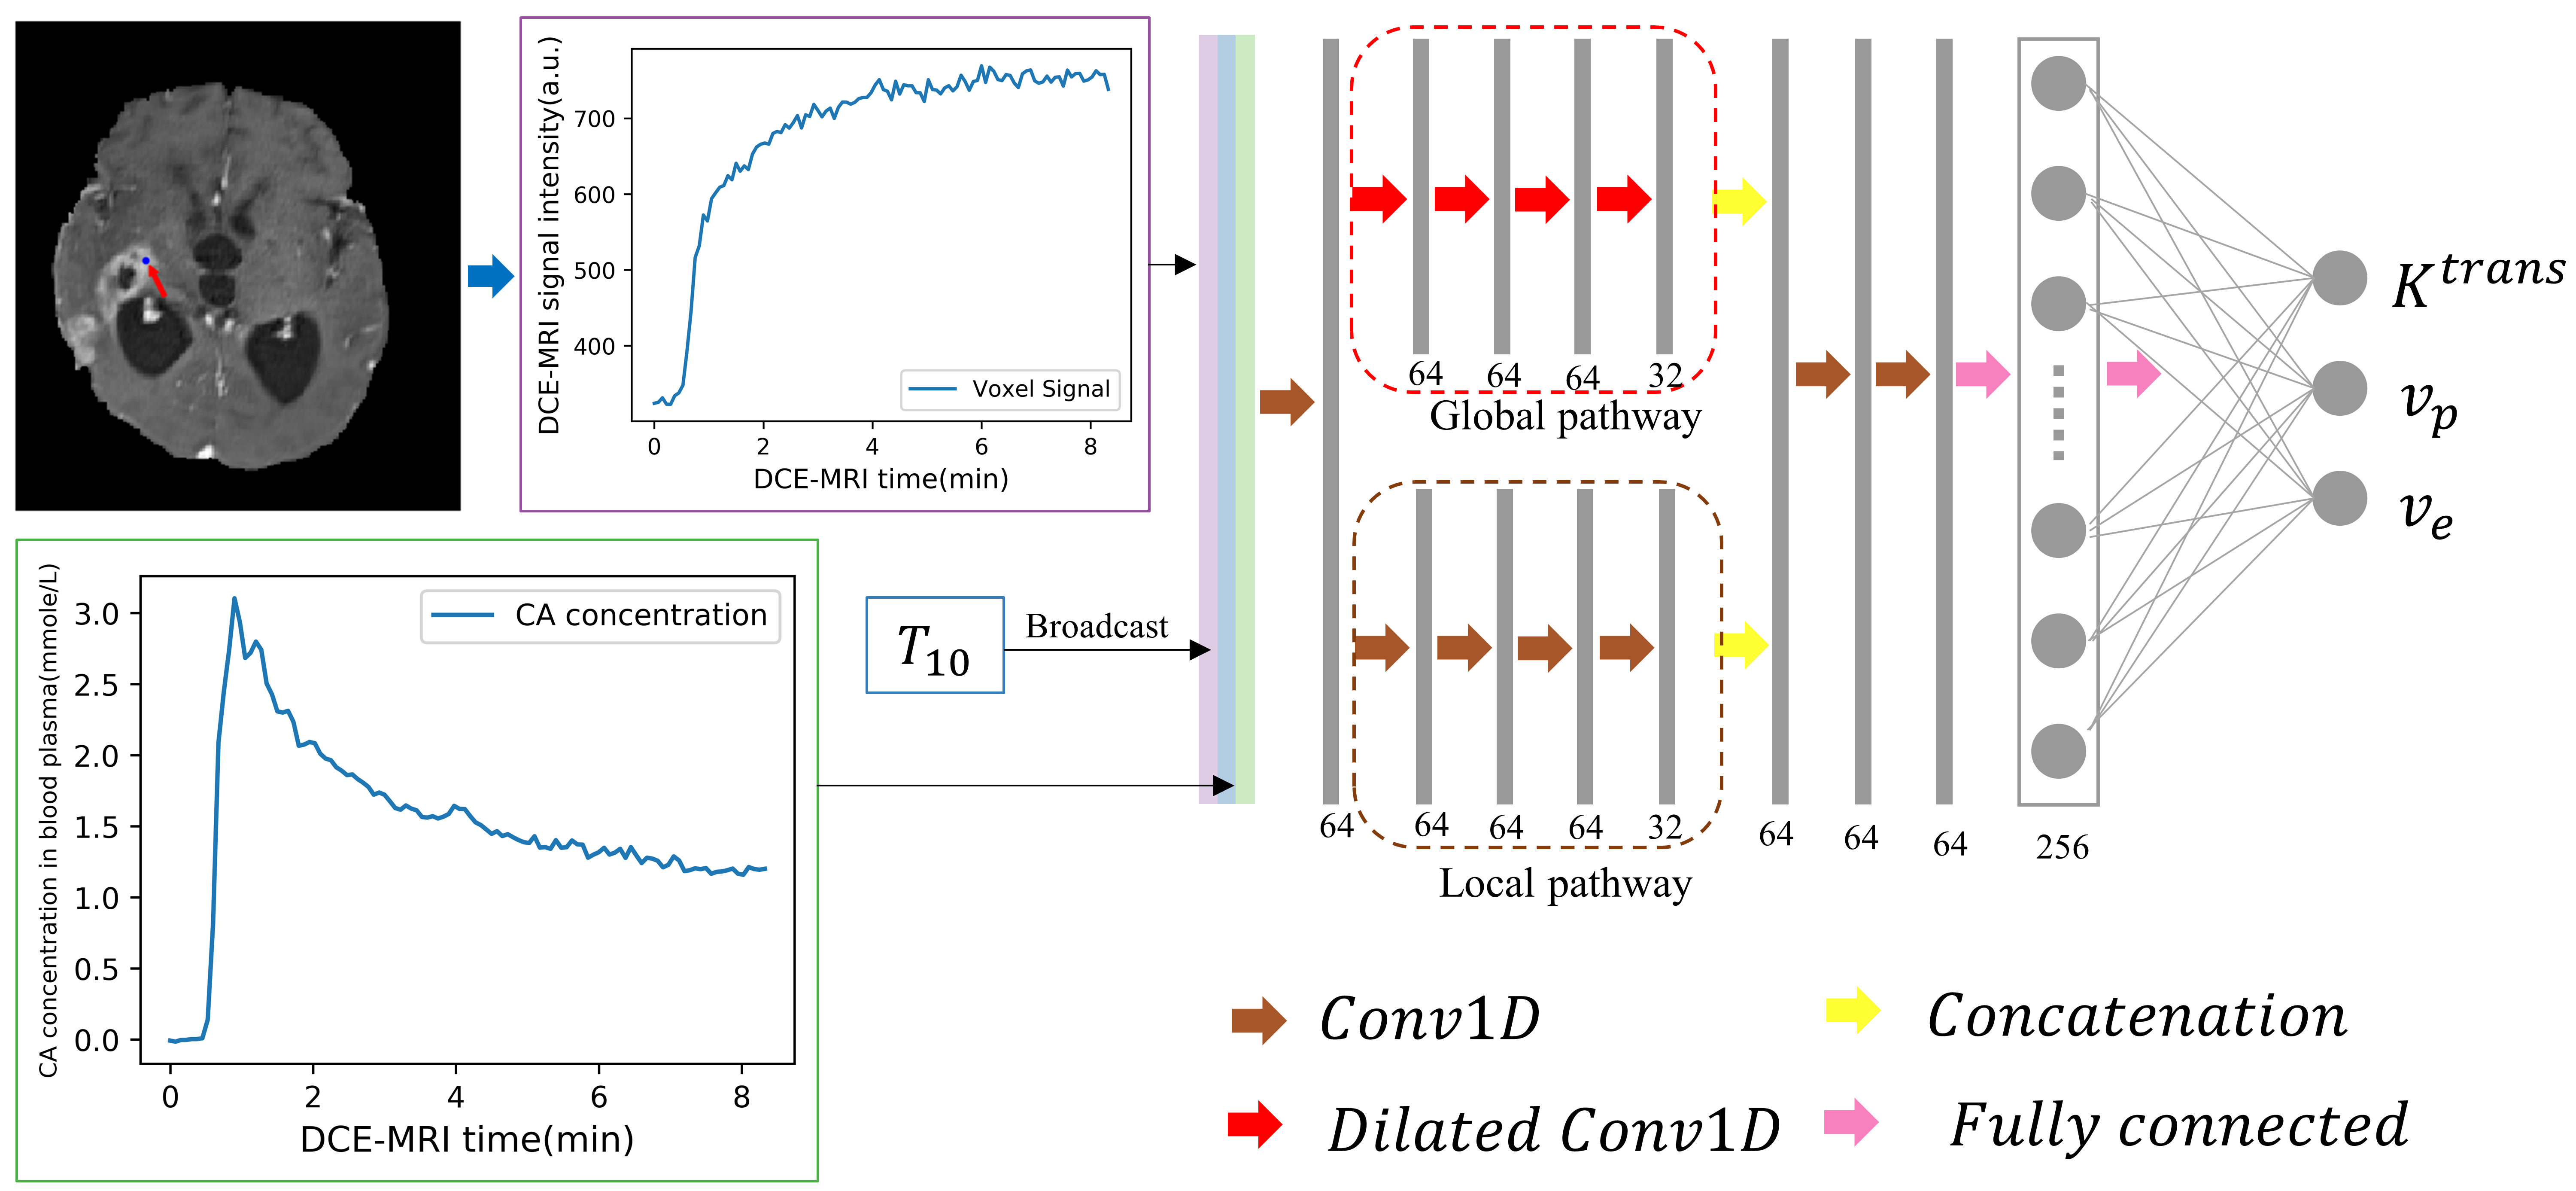
Figure 1. The proposed CNN
architecture for the estimation of pharmacokinetic parameters in the eTofts
model. The input data are the 1D DCE-MRI time series data, $$$C_p$$$ (contrast agent concentration in the blood plasma) and $$$T_{10}$$$ ( $$$T_{1}$$$ before contrast agent injection) for each voxel. The
number of filters and output nodes in the network are provided at the bottom of
each layer. The outputs from the proposed CNN are the three independent eTofts
parameters: $$$K^{trans}$$$, $$$v_p$$$ and $$$v_e$$$.
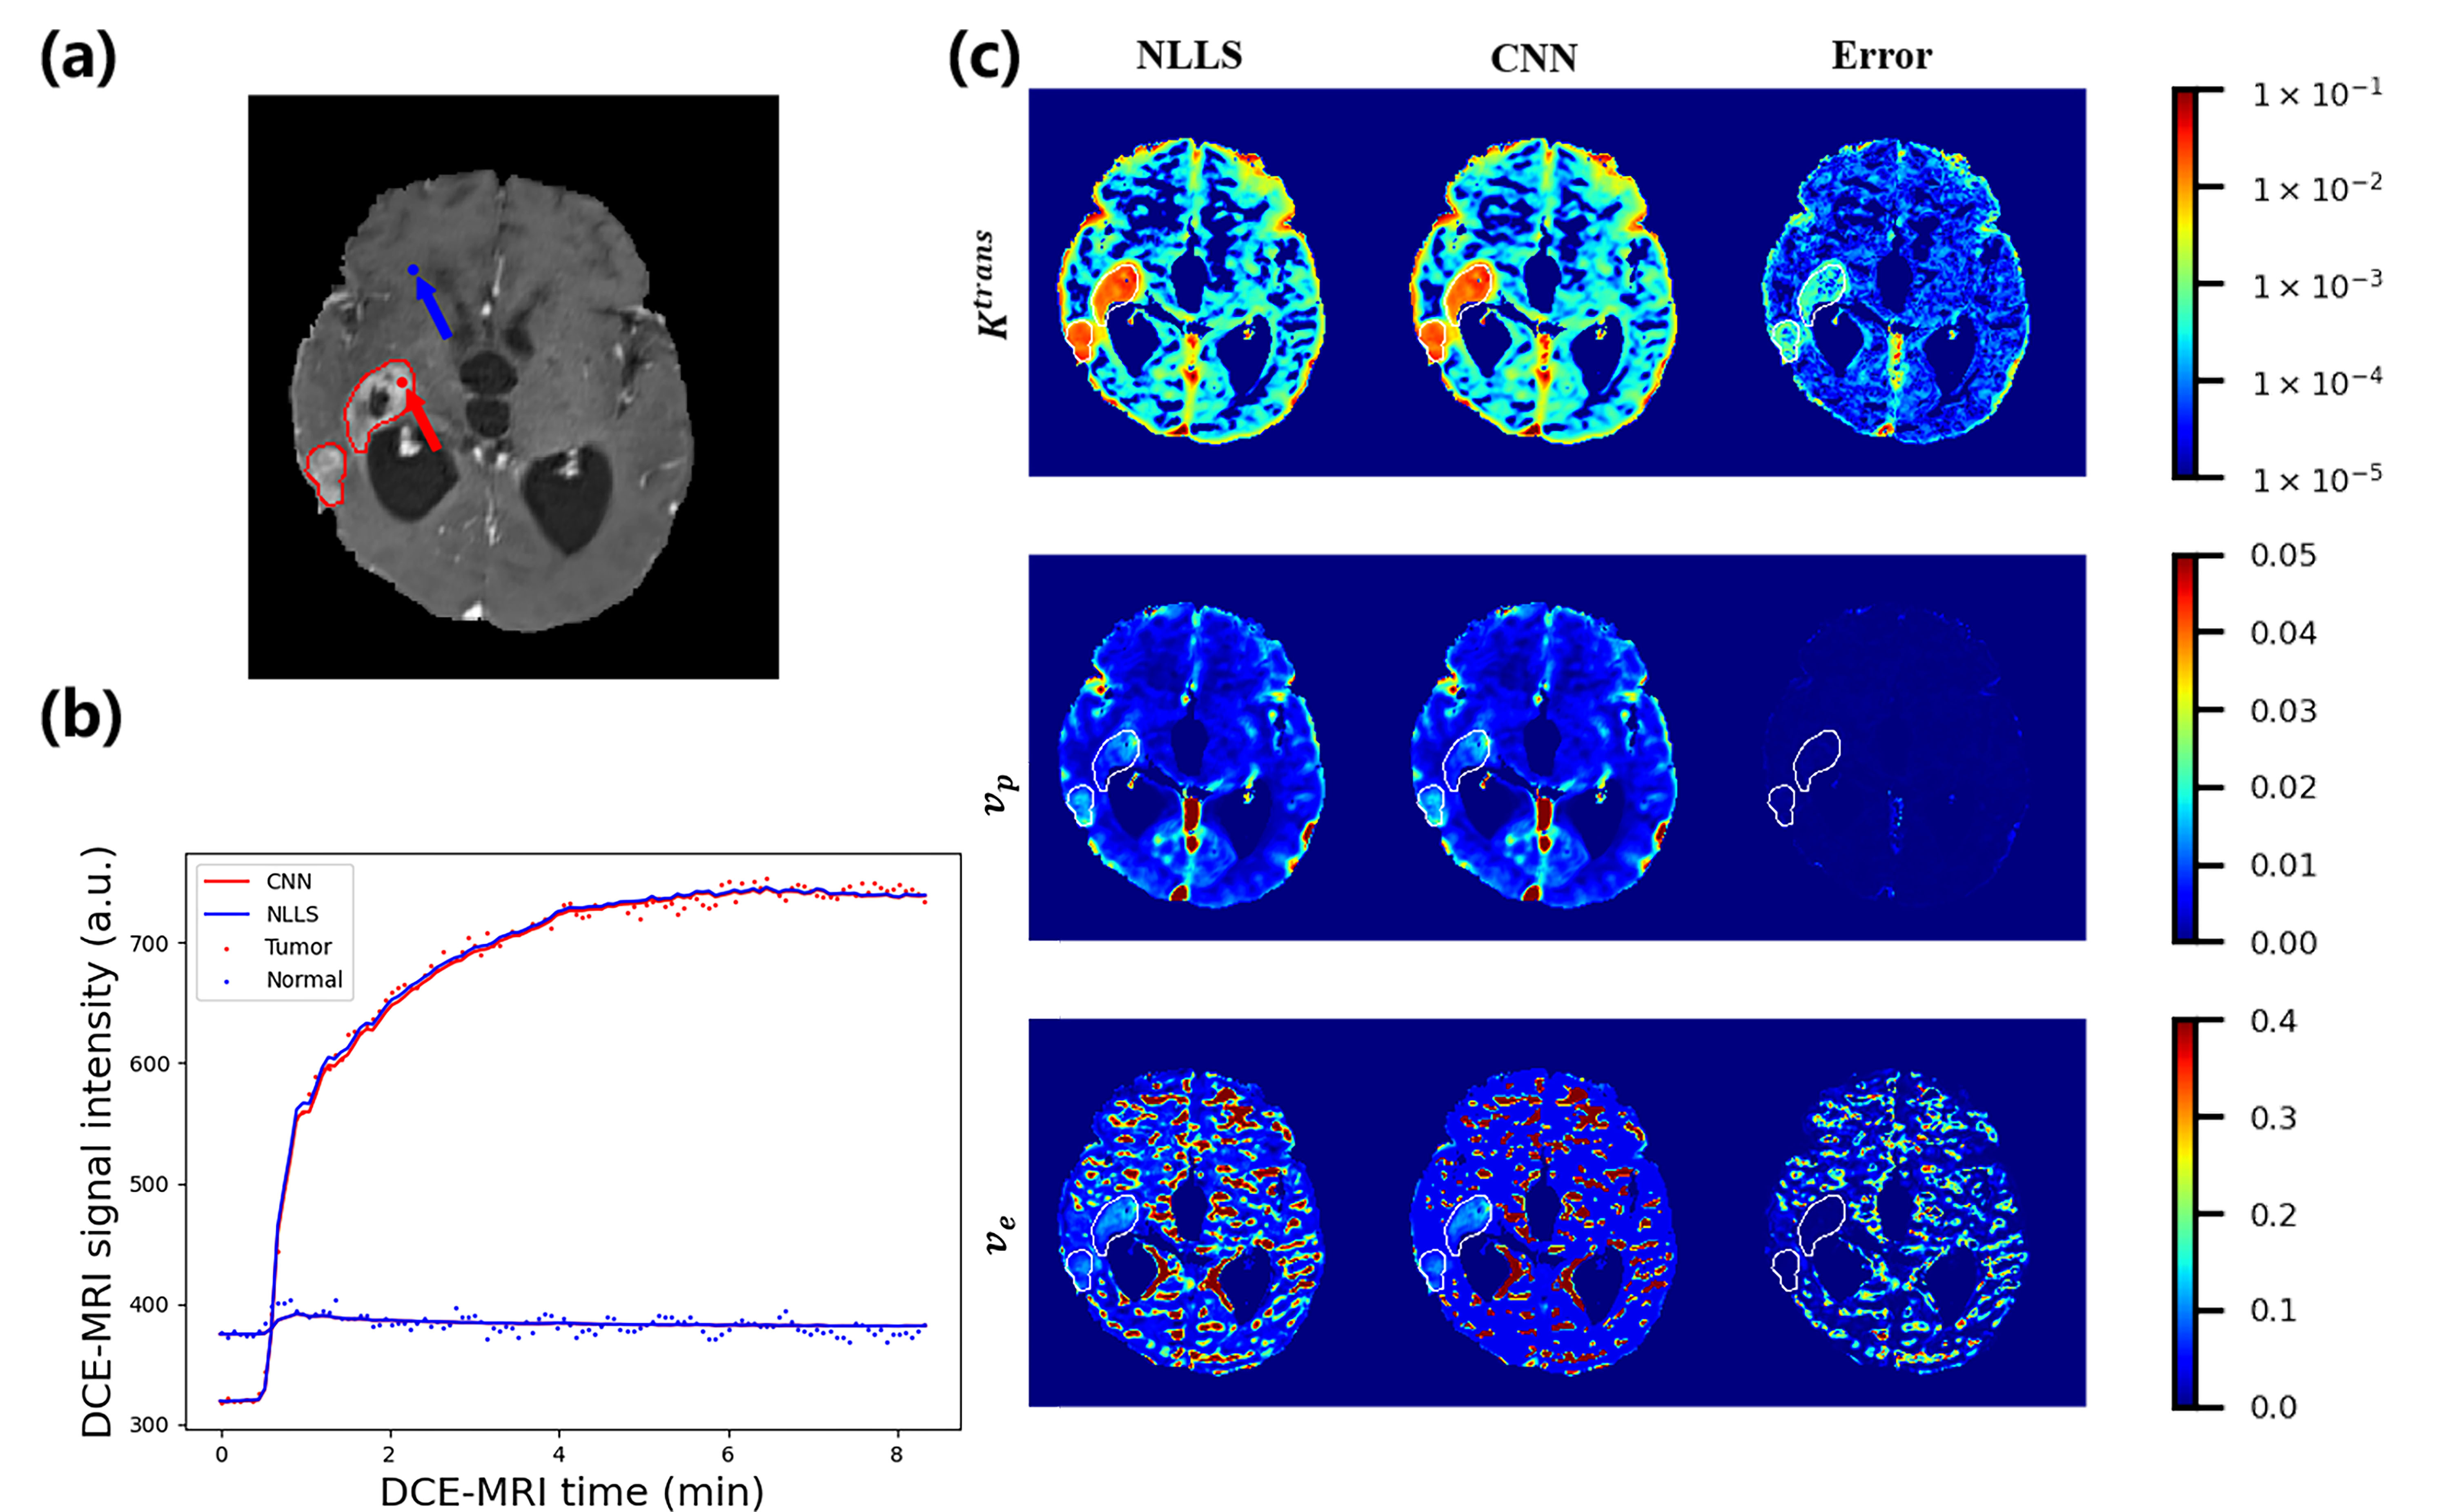
Figure 2. Example of the
results from conventional eTofts model fitting using nonlinear-least-squares
(NLLS) and CNN trained on mixed data in the testing dataset. (a) The contrast-enhanced
slice of one glioma subject, where the tumor is outlined
by solid red curves. (b) The predicted DCE-MRI time series signal using
parameters obtained from conventional NLLS fitting (blue curve) and the CNN (red
curve). (c) Pharmacokinetic parameter maps obtained from NLLS and the CNN, along
with the absolute difference (error map) between the results from
these two methods.