Michael S Stringer1,2, Cameron Manning1,2, Una Clancy1,2, Alasdair Morgan1,2, Zahra Shirzadi3,4, Francesca M Chappell1,2, Dany Jaime Garcia1,2, Angela CC Jochems1,2, Maria Valdes-Hernandez1,2, Stewart Wiseman1,2, Eleni Sakka1,2, Gordon W Blair1,2, Rosalind Brown1,2, Bradley MacIntosh3,4, Ian Marshall1,2, Fergus Doubal1,2, and Joanna M Wardlaw1,2
1Centre for Clinical Brain Sciences, University of Edinburgh, Edinburgh, United Kingdom, 2UK DRI at the University of Edinburgh, Edinburgh, United Kingdom, 3Hurvitz Brain Sciences Research Program, Sunnybrook Health Sciences Centre, Toronto, ON, Canada, 4Department of Medical Biophysics, University of Toronto, Toronto, ON, Canada
1Centre for Clinical Brain Sciences, University of Edinburgh, Edinburgh, United Kingdom, 2UK DRI at the University of Edinburgh, Edinburgh, United Kingdom, 3Hurvitz Brain Sciences Research Program, Sunnybrook Health Sciences Centre, Toronto, ON, Canada, 4Department of Medical Biophysics, University of Toronto, Toronto, ON, Canada
T1 can vary in mild stroke patients. We calculated
cerebral blood flow (CBF) using subject-specific quantitative T1
finding lower grey and higher white matter CBF than standard processing. CBF
was also lower in patients with higher disease severity.
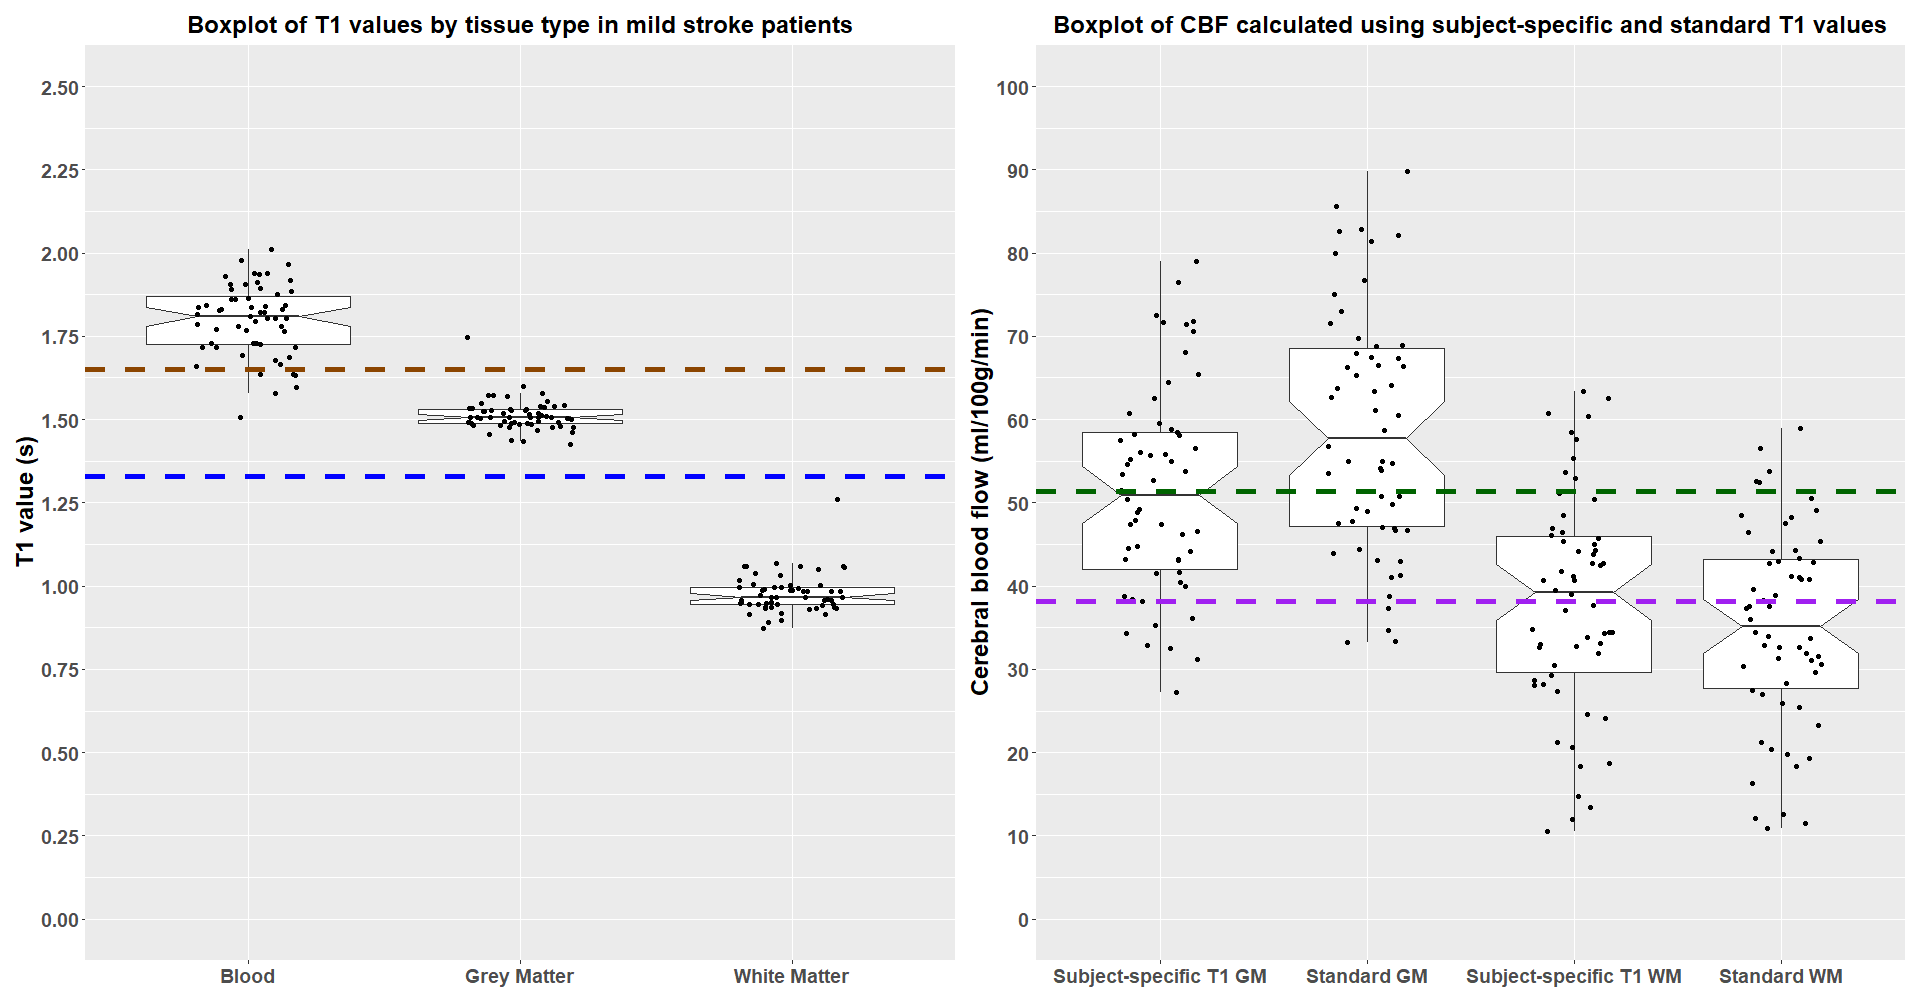
Figure 1: Box
plots showing the distribution of: A) the subject-specific T1
values with nominal T1 values for blood (1.65 s) and tissue
(1.33 s) plotted in brown and blue respectively; B) cerebral blood flow (CBF)
calculated with nominal and subject-specific T1 values, mean
CBF values using the estimated T1 values are plotted
in green (grey matter, GM) and purple (white matter, WM).
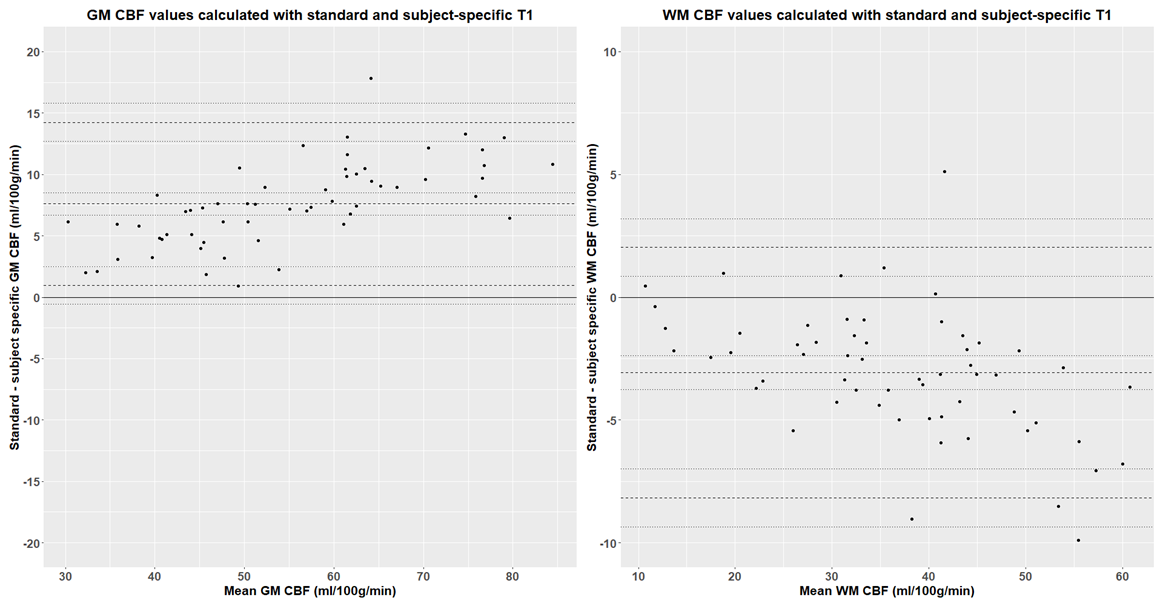
Figure 2: Bland-Altman
plots of cerebral blood flow (CBF) values in grey (GM) and white matter (WM) calculated
using the calculated using standard (tissue=1.33 s, blood=1.65 s) and
subject-specific T1 values.