Ruvini Navaratna1,2, Daiki Tamada2, Gregory Simchick2, Diego Hernando1,2, and Scott B Reeder1,2,3,4,5
1Medical Physics, University of Wisconsin - Madison, Madison, WI, United States, 2Radiology, University of Wisconsin - Madison, Madison, WI, United States, 3Biomedical Engineering, University of Wisconsin - Madison, Madison, WI, United States, 4Medicine, University of Wisconsin - Madison, Madison, WI, United States, 5Emergency Medicine, University of Wisconsin - Madison, Madison, WI, United States
1Medical Physics, University of Wisconsin - Madison, Madison, WI, United States, 2Radiology, University of Wisconsin - Madison, Madison, WI, United States, 3Biomedical Engineering, University of Wisconsin - Madison, Madison, WI, United States, 4Medicine, University of Wisconsin - Madison, Madison, WI, United States, 5Emergency Medicine, University of Wisconsin - Madison, Madison, WI, United States
We present a
modified 3D phase-based T2 mapping approach to quantify short T2 values seen in
liver iron overload within a breath-hold. Short T2 values were successfully
quantified in simulations, phantom experiments, and in vivo studies.
Figure
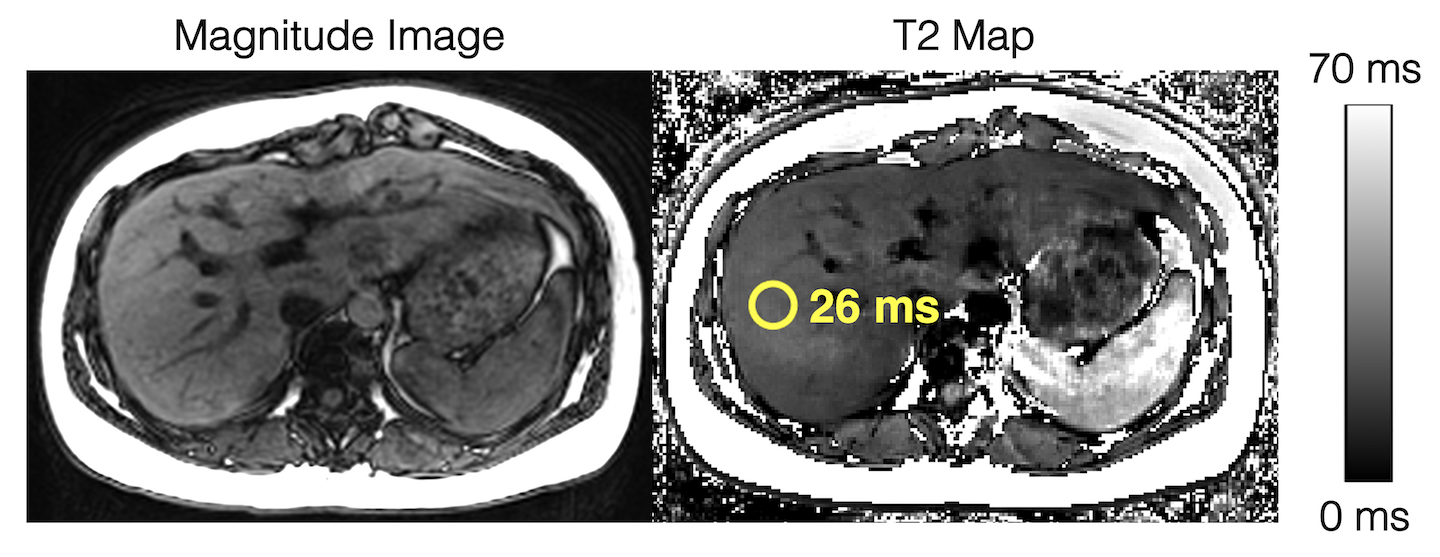
4. In vivo feasibility studies demonstrate diagnostic image quality for T2
estimation in the liver using the modified phase-based T2 mapping method. An
ROI drawn in the liver shows a T2 estimate of 26ms. Multi-TE STEAM-MRS shows a
T2 estimate of 28ms. The phase-based T2 map is generated assuming T1 = 1000ms, while the T2 estimate in the ROI is estimated using "average first, fit second" and a T1-corrected T2 estimation.
Figure
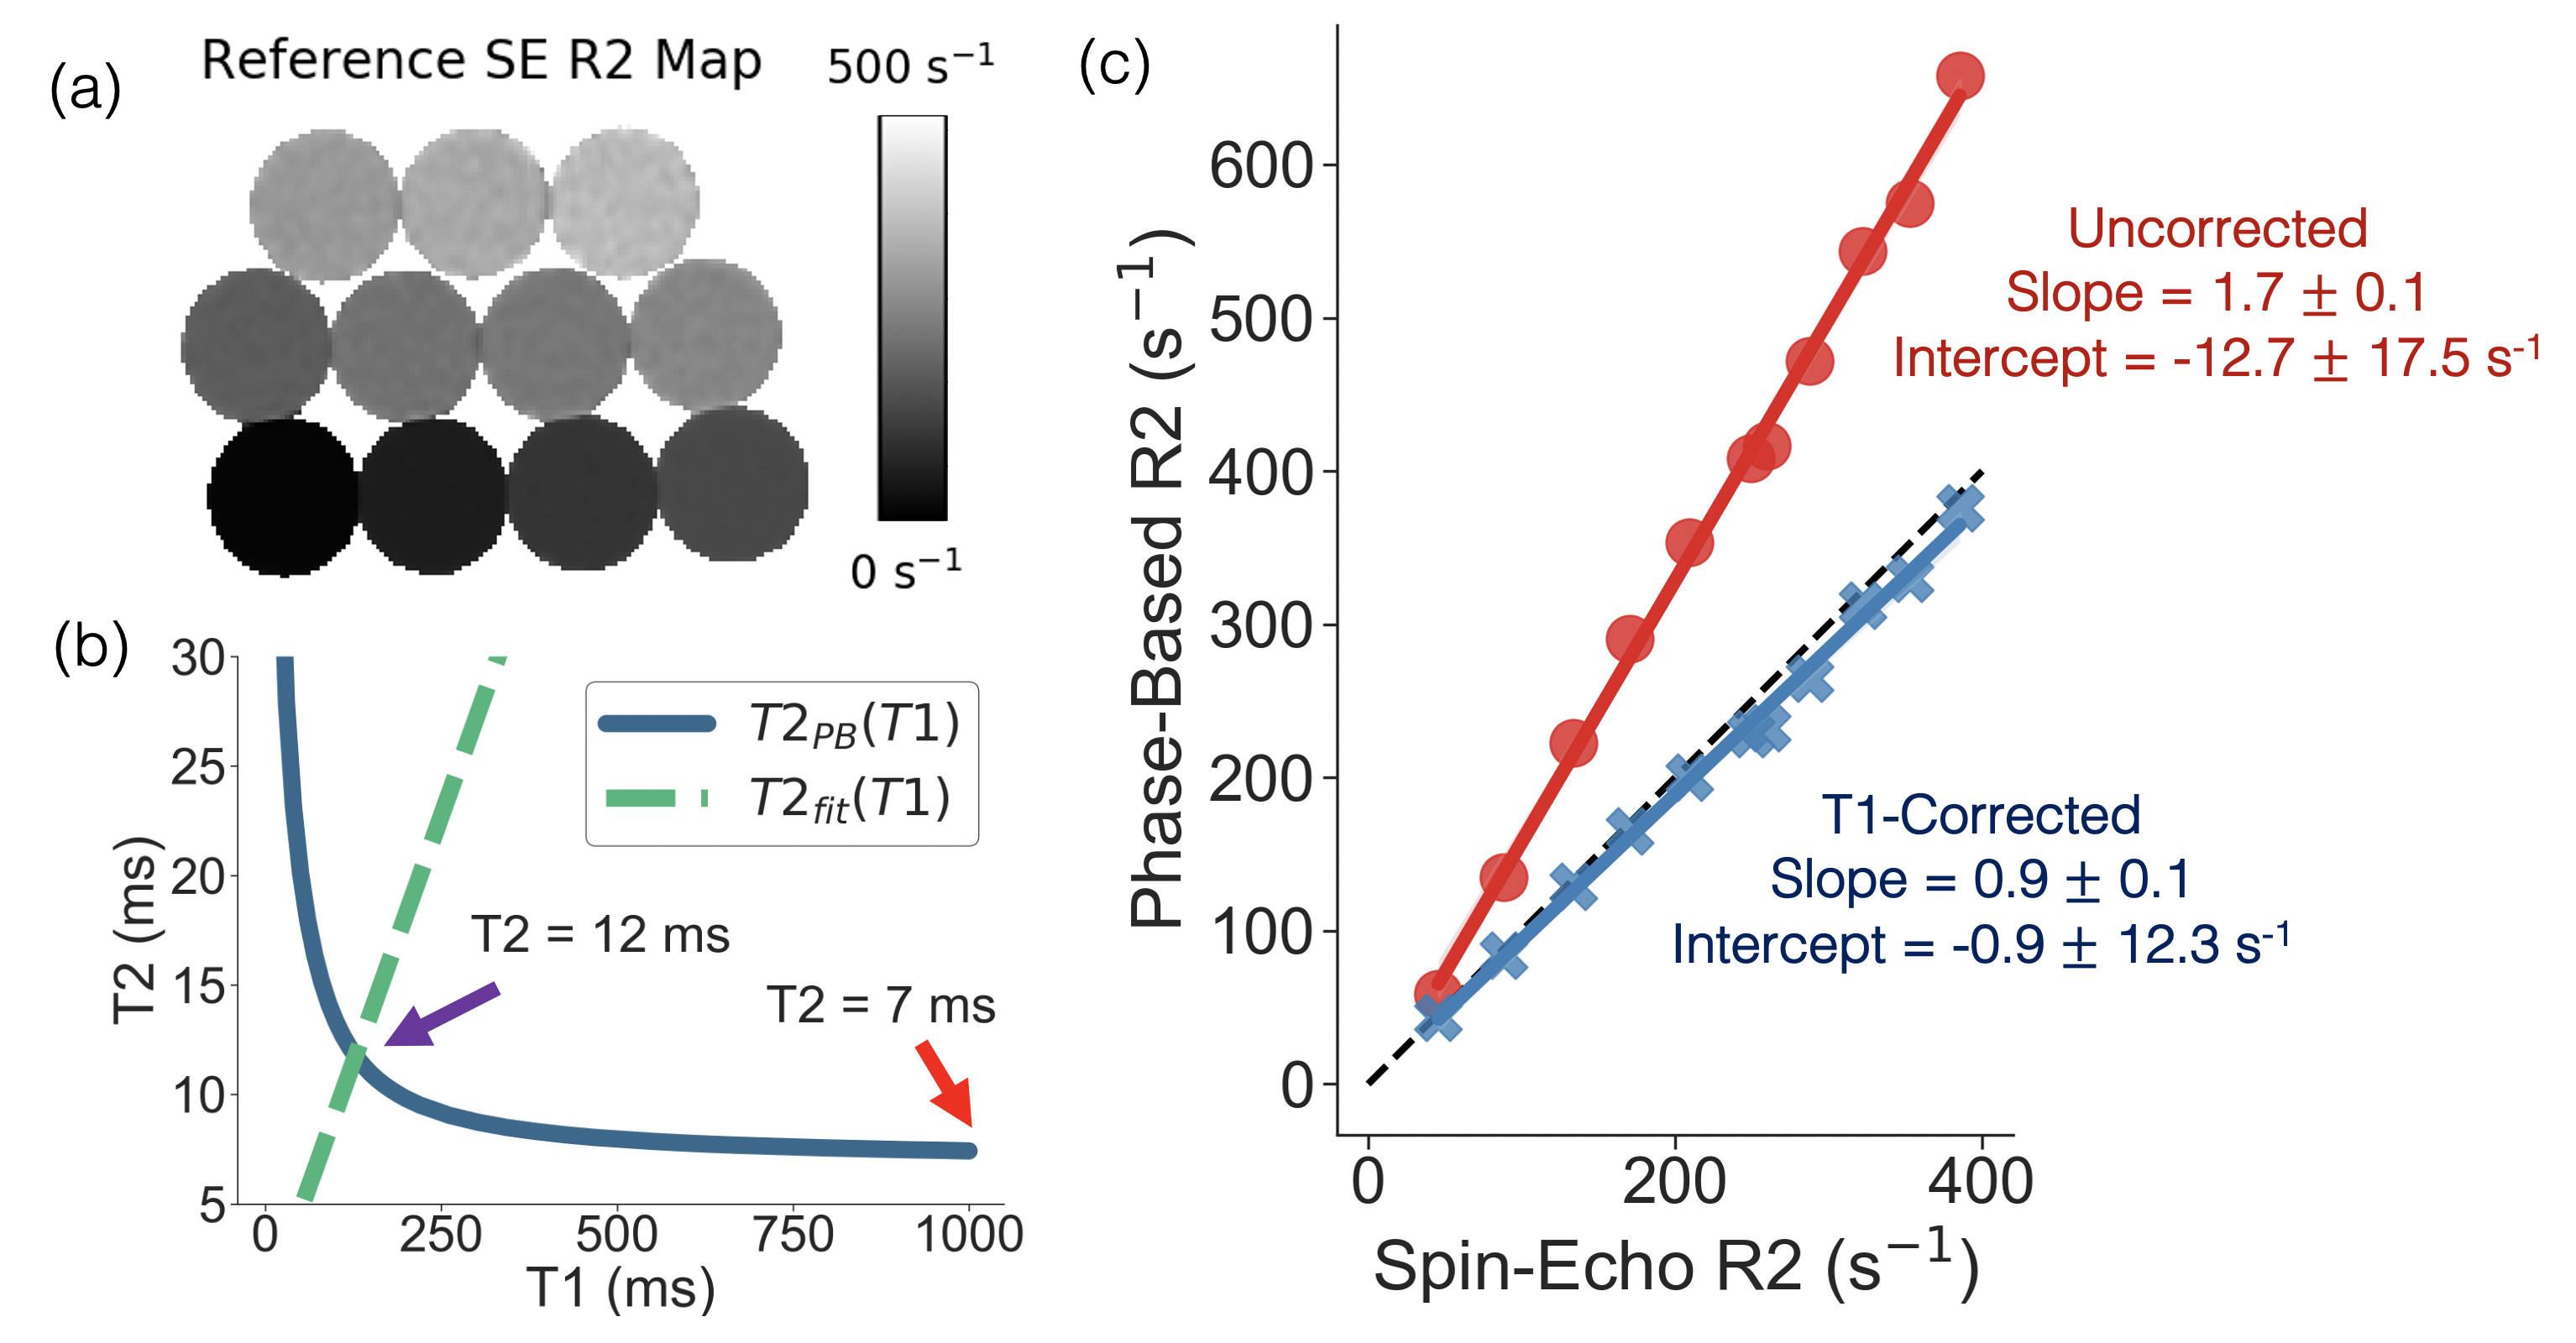
3. Phantom experiments demonstrate improved T2/R2 estimation with the
T1-corrected phase-based T2 mapping method. (a) Reference R2 map generated from
a single-echo SE sequence. (b) An example of T2PB(T1), T2fit(T1), and
the uncorrected (red arrow) and corrected (purple arrow) T2 estimate are
plotted for a single vial (reference T2 = 11ms). (c) Linear regressions of
phase-based R2 as a function of single-echo SE R2 for the uncorrected
(assuming T1 = 1000ms) and T1-corrected phase-based T2 method are shown. Slope and intercept are shown with their 95% confidence
interval.