Qing Wang1, Ye Sheng2, HaiFeng Liu2, Zuhui Zhu2, wei Xing2, and Jilei Zhang3
1Radiology, Third Affiliated Hospital of Soochow University & First People's Hospital of Changzhou, changzhou, China, 2Third Affiliated Hospital of Soochow University & First People's Hospital of Changzhou, changzhou, China, 3Healthcare,Shanghai,China, shanghai, China
1Radiology, Third Affiliated Hospital of Soochow University & First People's Hospital of Changzhou, changzhou, China, 2Third Affiliated Hospital of Soochow University & First People's Hospital of Changzhou, changzhou, China, 3Healthcare,Shanghai,China, shanghai, China
Histogram analysis have advantages over conventional representative ROI selection for LF.Entropy characterizes image complexity by evaluating fibrosis heterogeneity and Entropy20min has a substantial advantage as a biomarker of LF.
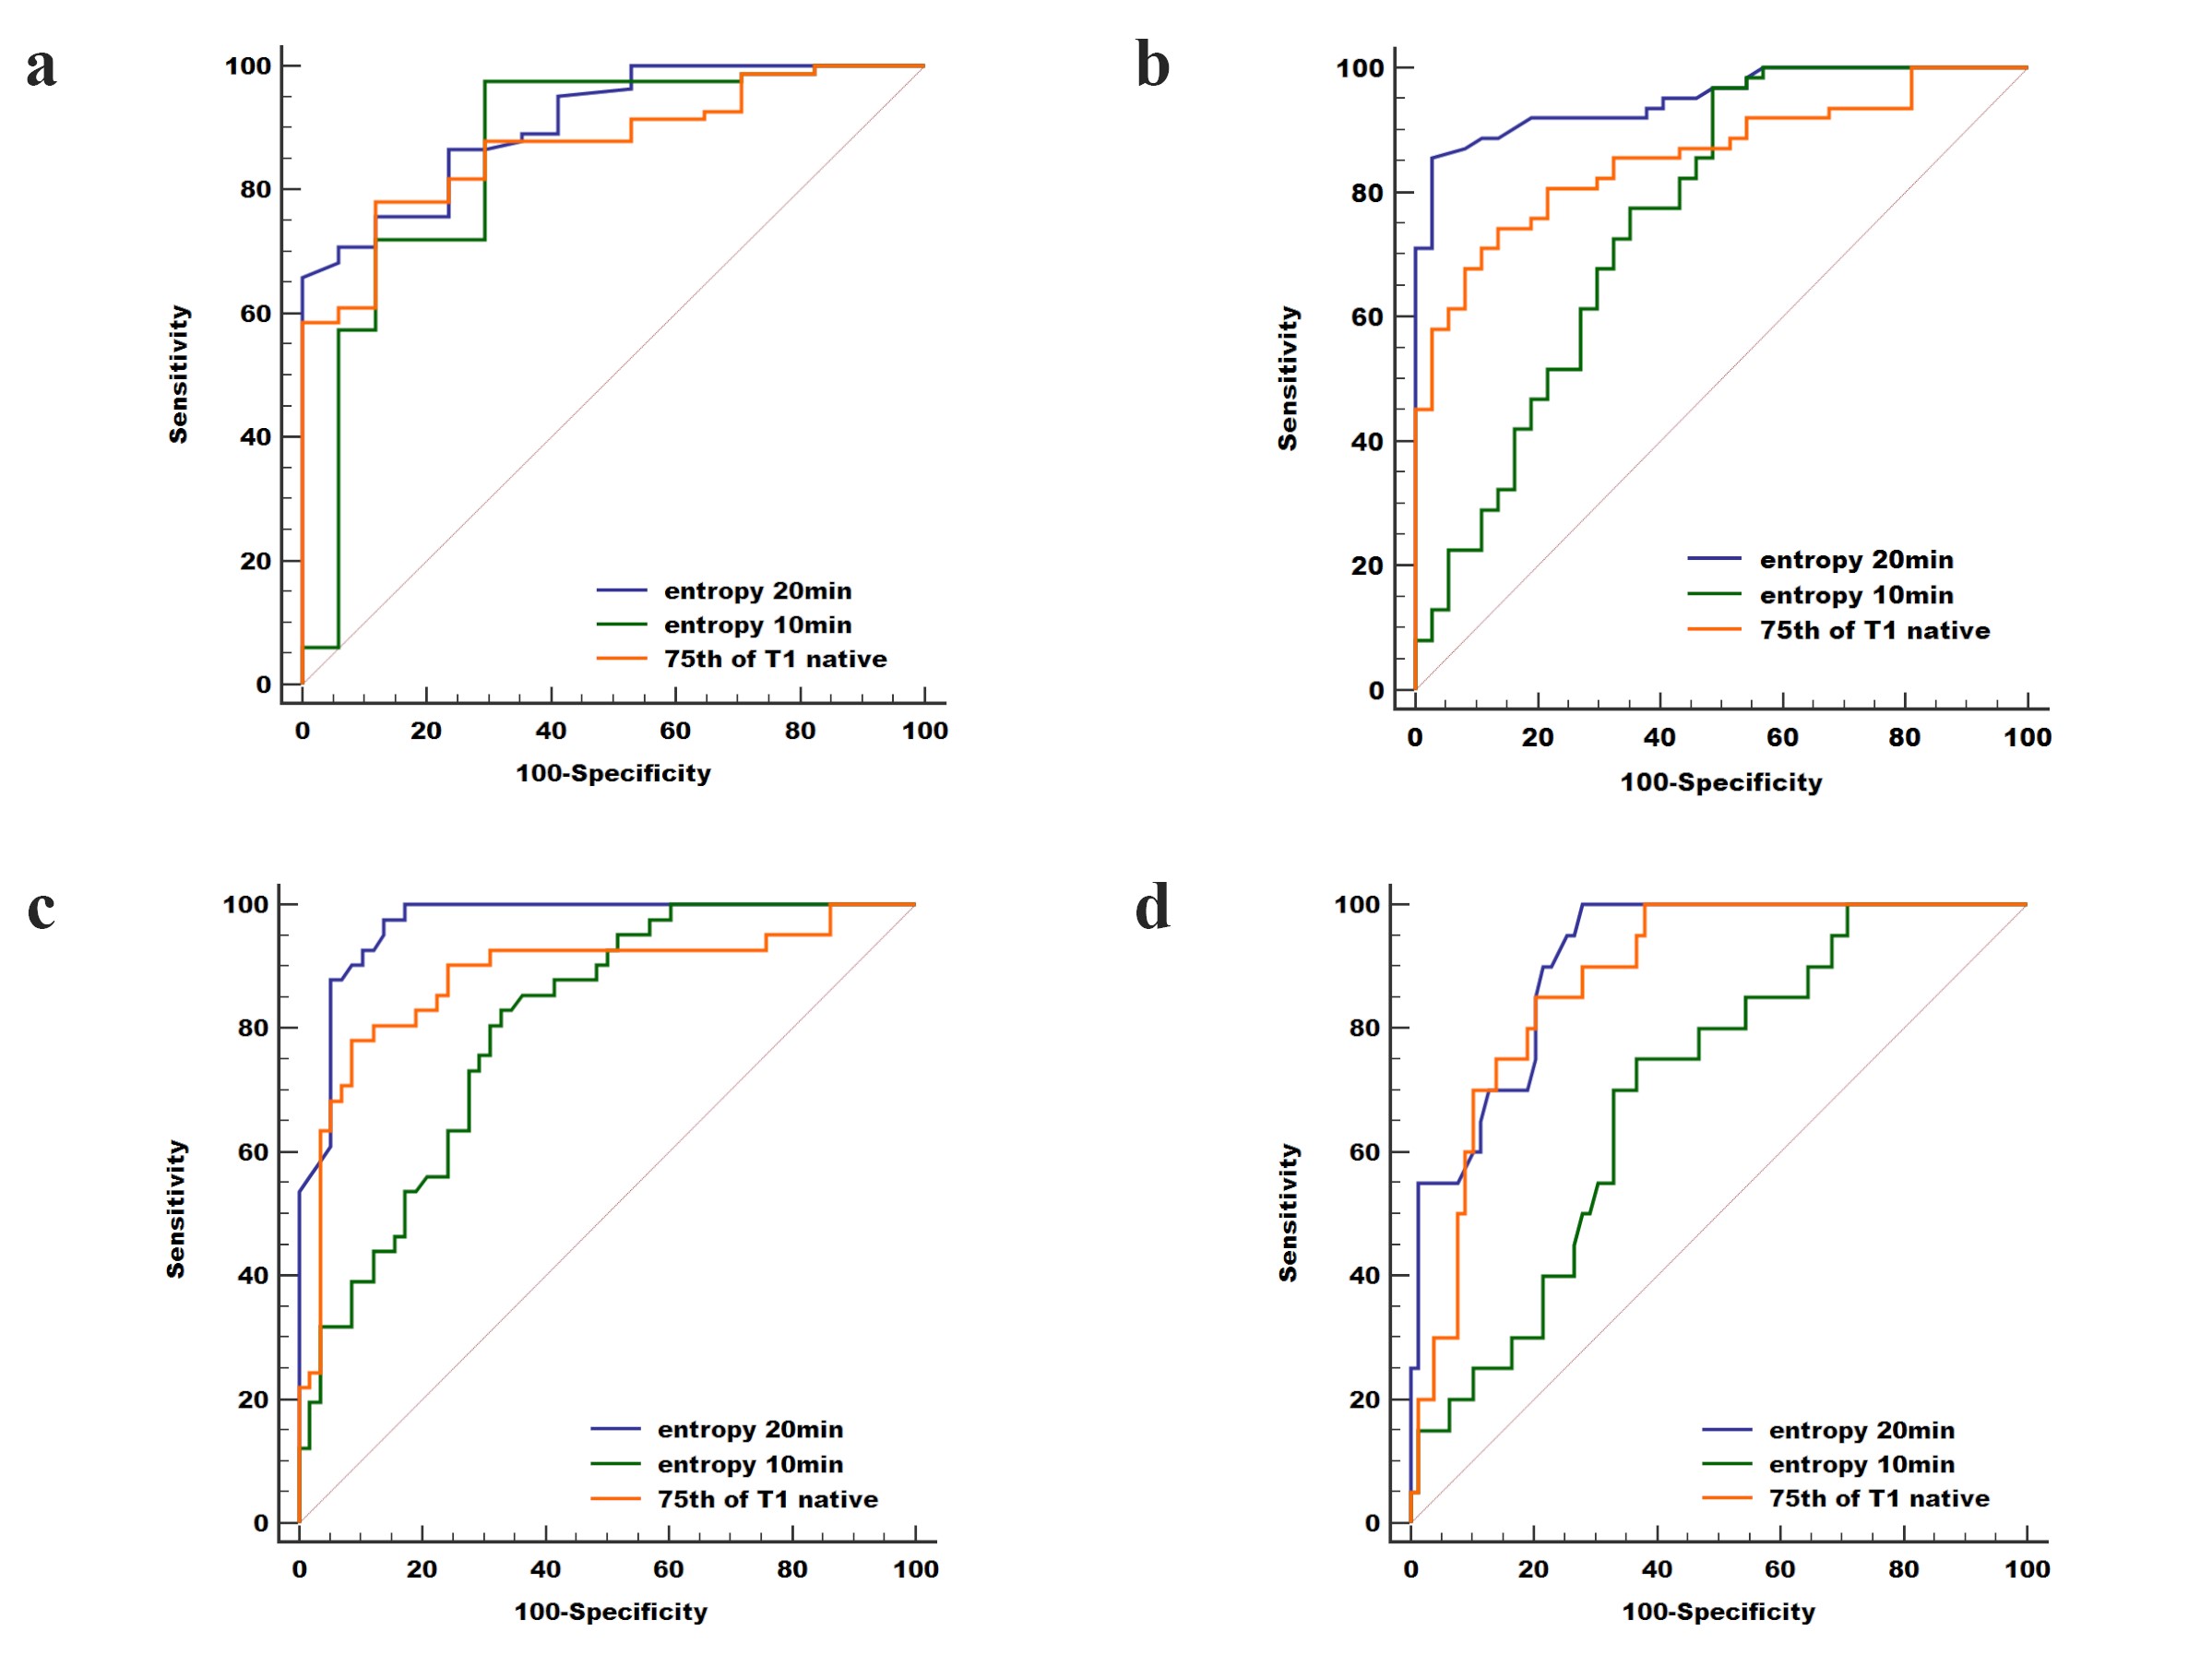
Comparisons of the
diagnostic ability of three optimal parameters (75th of T1native, entropy20min
and entropy10min) for discriminating LF ≥ F1 (a), ≥ F2 (b), ≥ F3
(c) and F4 (d), respectively. Entropy20min showed
the highest diagnostic
performance, with AUC=0.908, 0.951, 0.969, and 0.914, respectively.
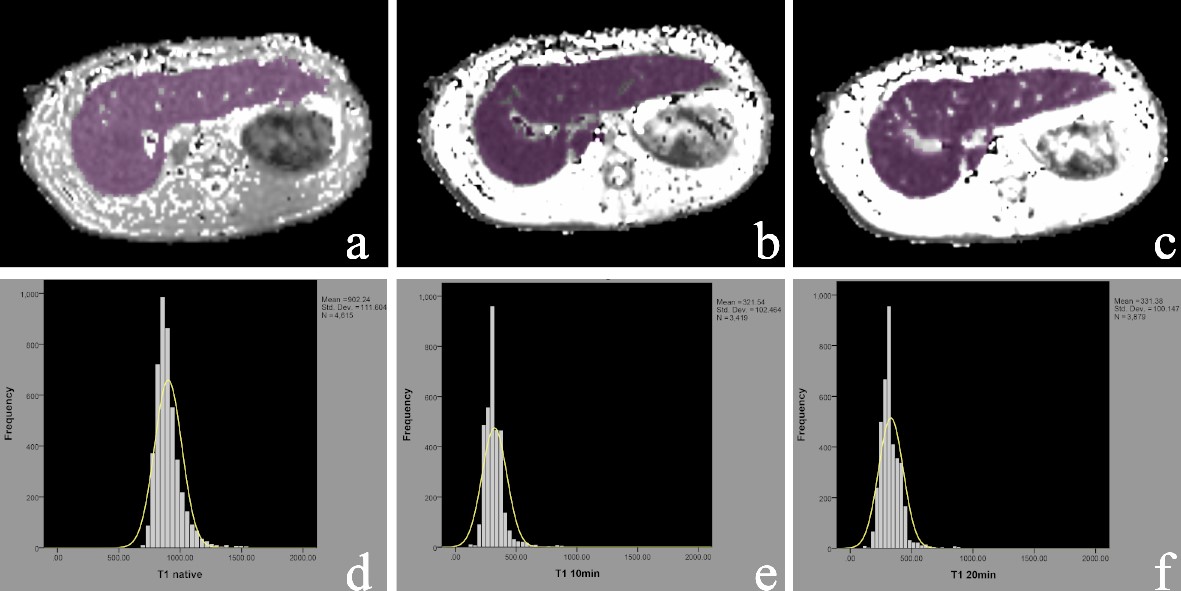
Examples of ROIs
drawn over T1 maps of F1 liver tissue. The liver borders, major vessels, and
gallbladder were manually excluded. The ROIs were delineated to include the
whole liver on all slices for T1native (a), T110min (b), and T120min (c), and a minor adjustment was adopted to update the ROI. The histogram curves of T1native (d), T110min (e), and T120min (f) are shown.