Zheng Zhu1, Alina M. Allen2, Terry Therneau3, Xin Lu1, Kevin J. Glaser1, Jiahui Li1, Jingbiao Chen1,4, Jie Chen1,5, Safa Hoodeshenas1, Sudhakar K. Venkatesh1, Armando Manduca1,6, Richard L. Ehman1, and Meng Yin1
1Department of Radiology, Mayo Clinic, Rochester, MN, United States, 2Devision of Gastroenterology and Hepatology, Mayo Clinic, Rochester, MN, United States, 3Devision of Biomedical Statistics and Informatics, Mayo Clinic, Rochester, MN, United States, 4Department of Radiology, the Third Affiliated Hospital of Sun Yat-Sen University, Guangdong, China, 5Department of Radiology, West China Hospital, Chengdu, Sichuan, China, 6Devision of Physiology and Biomedical Engineering, Mayo Clinic, Rochester, MN, United States
1Department of Radiology, Mayo Clinic, Rochester, MN, United States, 2Devision of Gastroenterology and Hepatology, Mayo Clinic, Rochester, MN, United States, 3Devision of Biomedical Statistics and Informatics, Mayo Clinic, Rochester, MN, United States, 4Department of Radiology, the Third Affiliated Hospital of Sun Yat-Sen University, Guangdong, China, 5Department of Radiology, West China Hospital, Chengdu, Sichuan, China, 6Devision of Physiology and Biomedical Engineering, Mayo Clinic, Rochester, MN, United States
In the clinical management of nonalcoholic fatty liver disease, longitudinal fat fraction and liver stiffness measurements have the potential to predict fibrosis progression rate, thus identifying individuals at high risk of rapid progression.
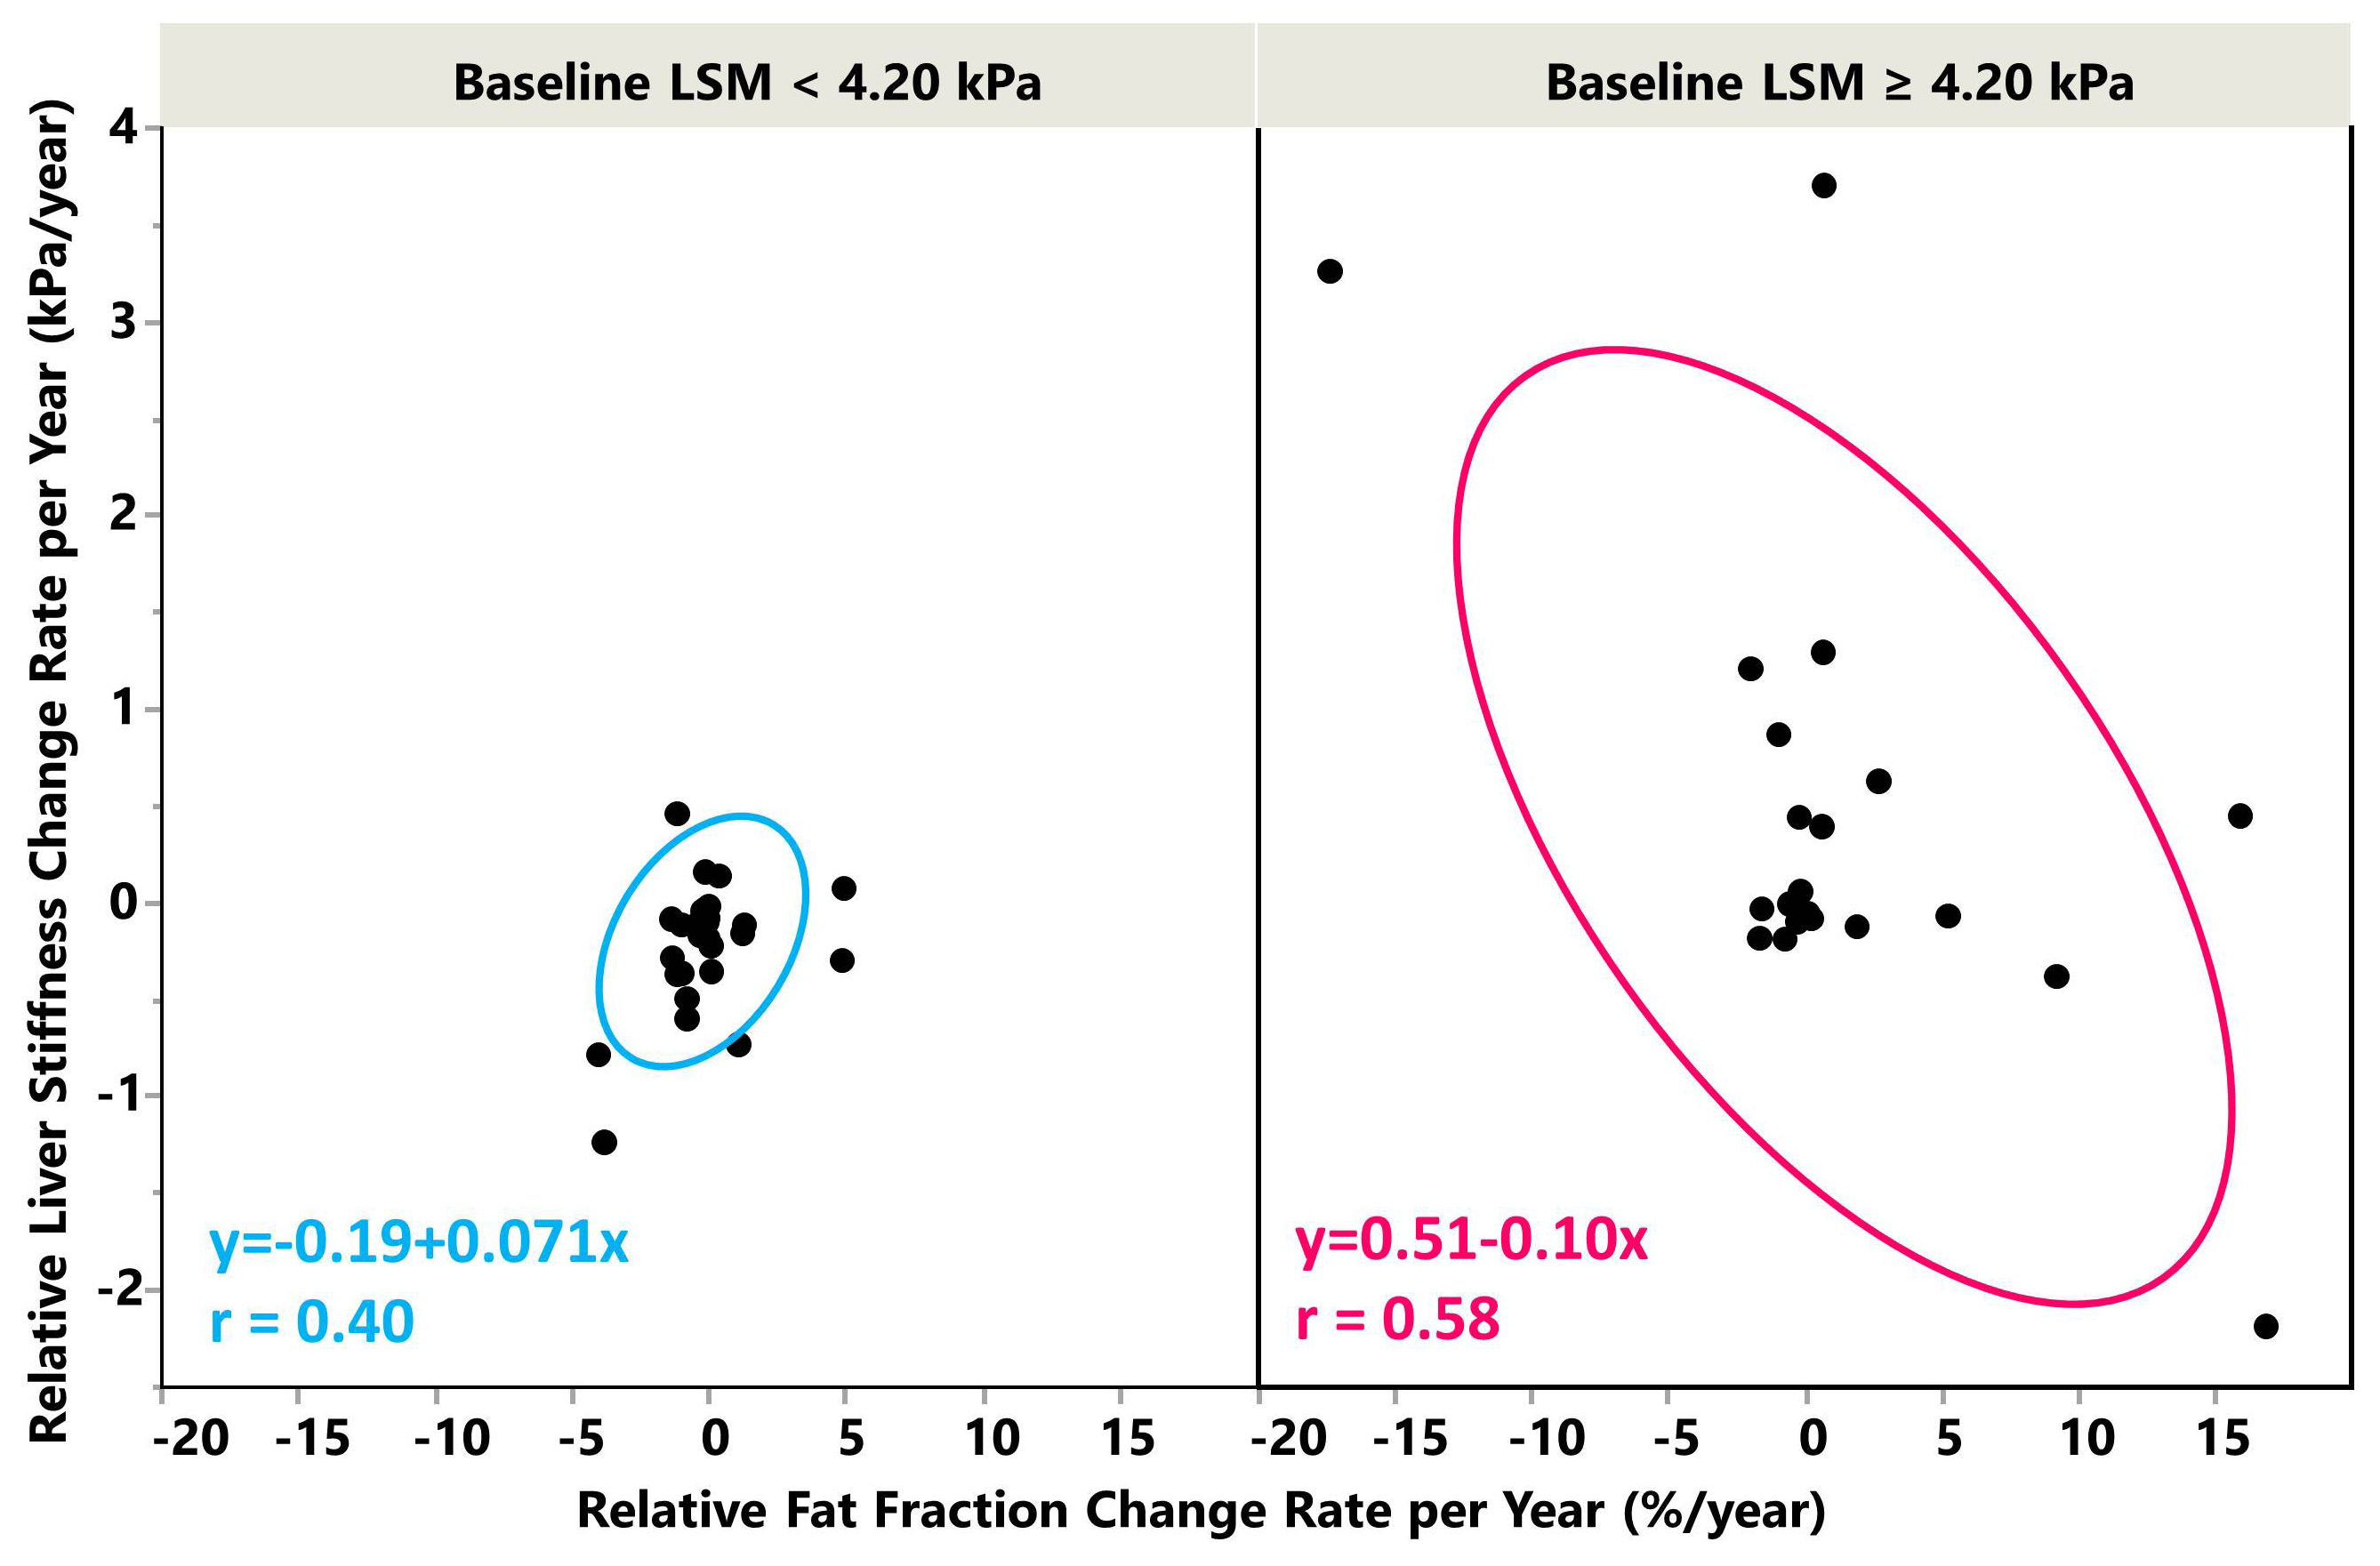
The scatter plots of ΔLSM and ΔPDFF per year
and their relationship in the noncirrhotic (left) and cirrhotic (right) groups.
In the noncirrhotic group, low change rates and a positive correlation were
observed. In the cirrhotic group, high
change rates and a negative correlation were observed.
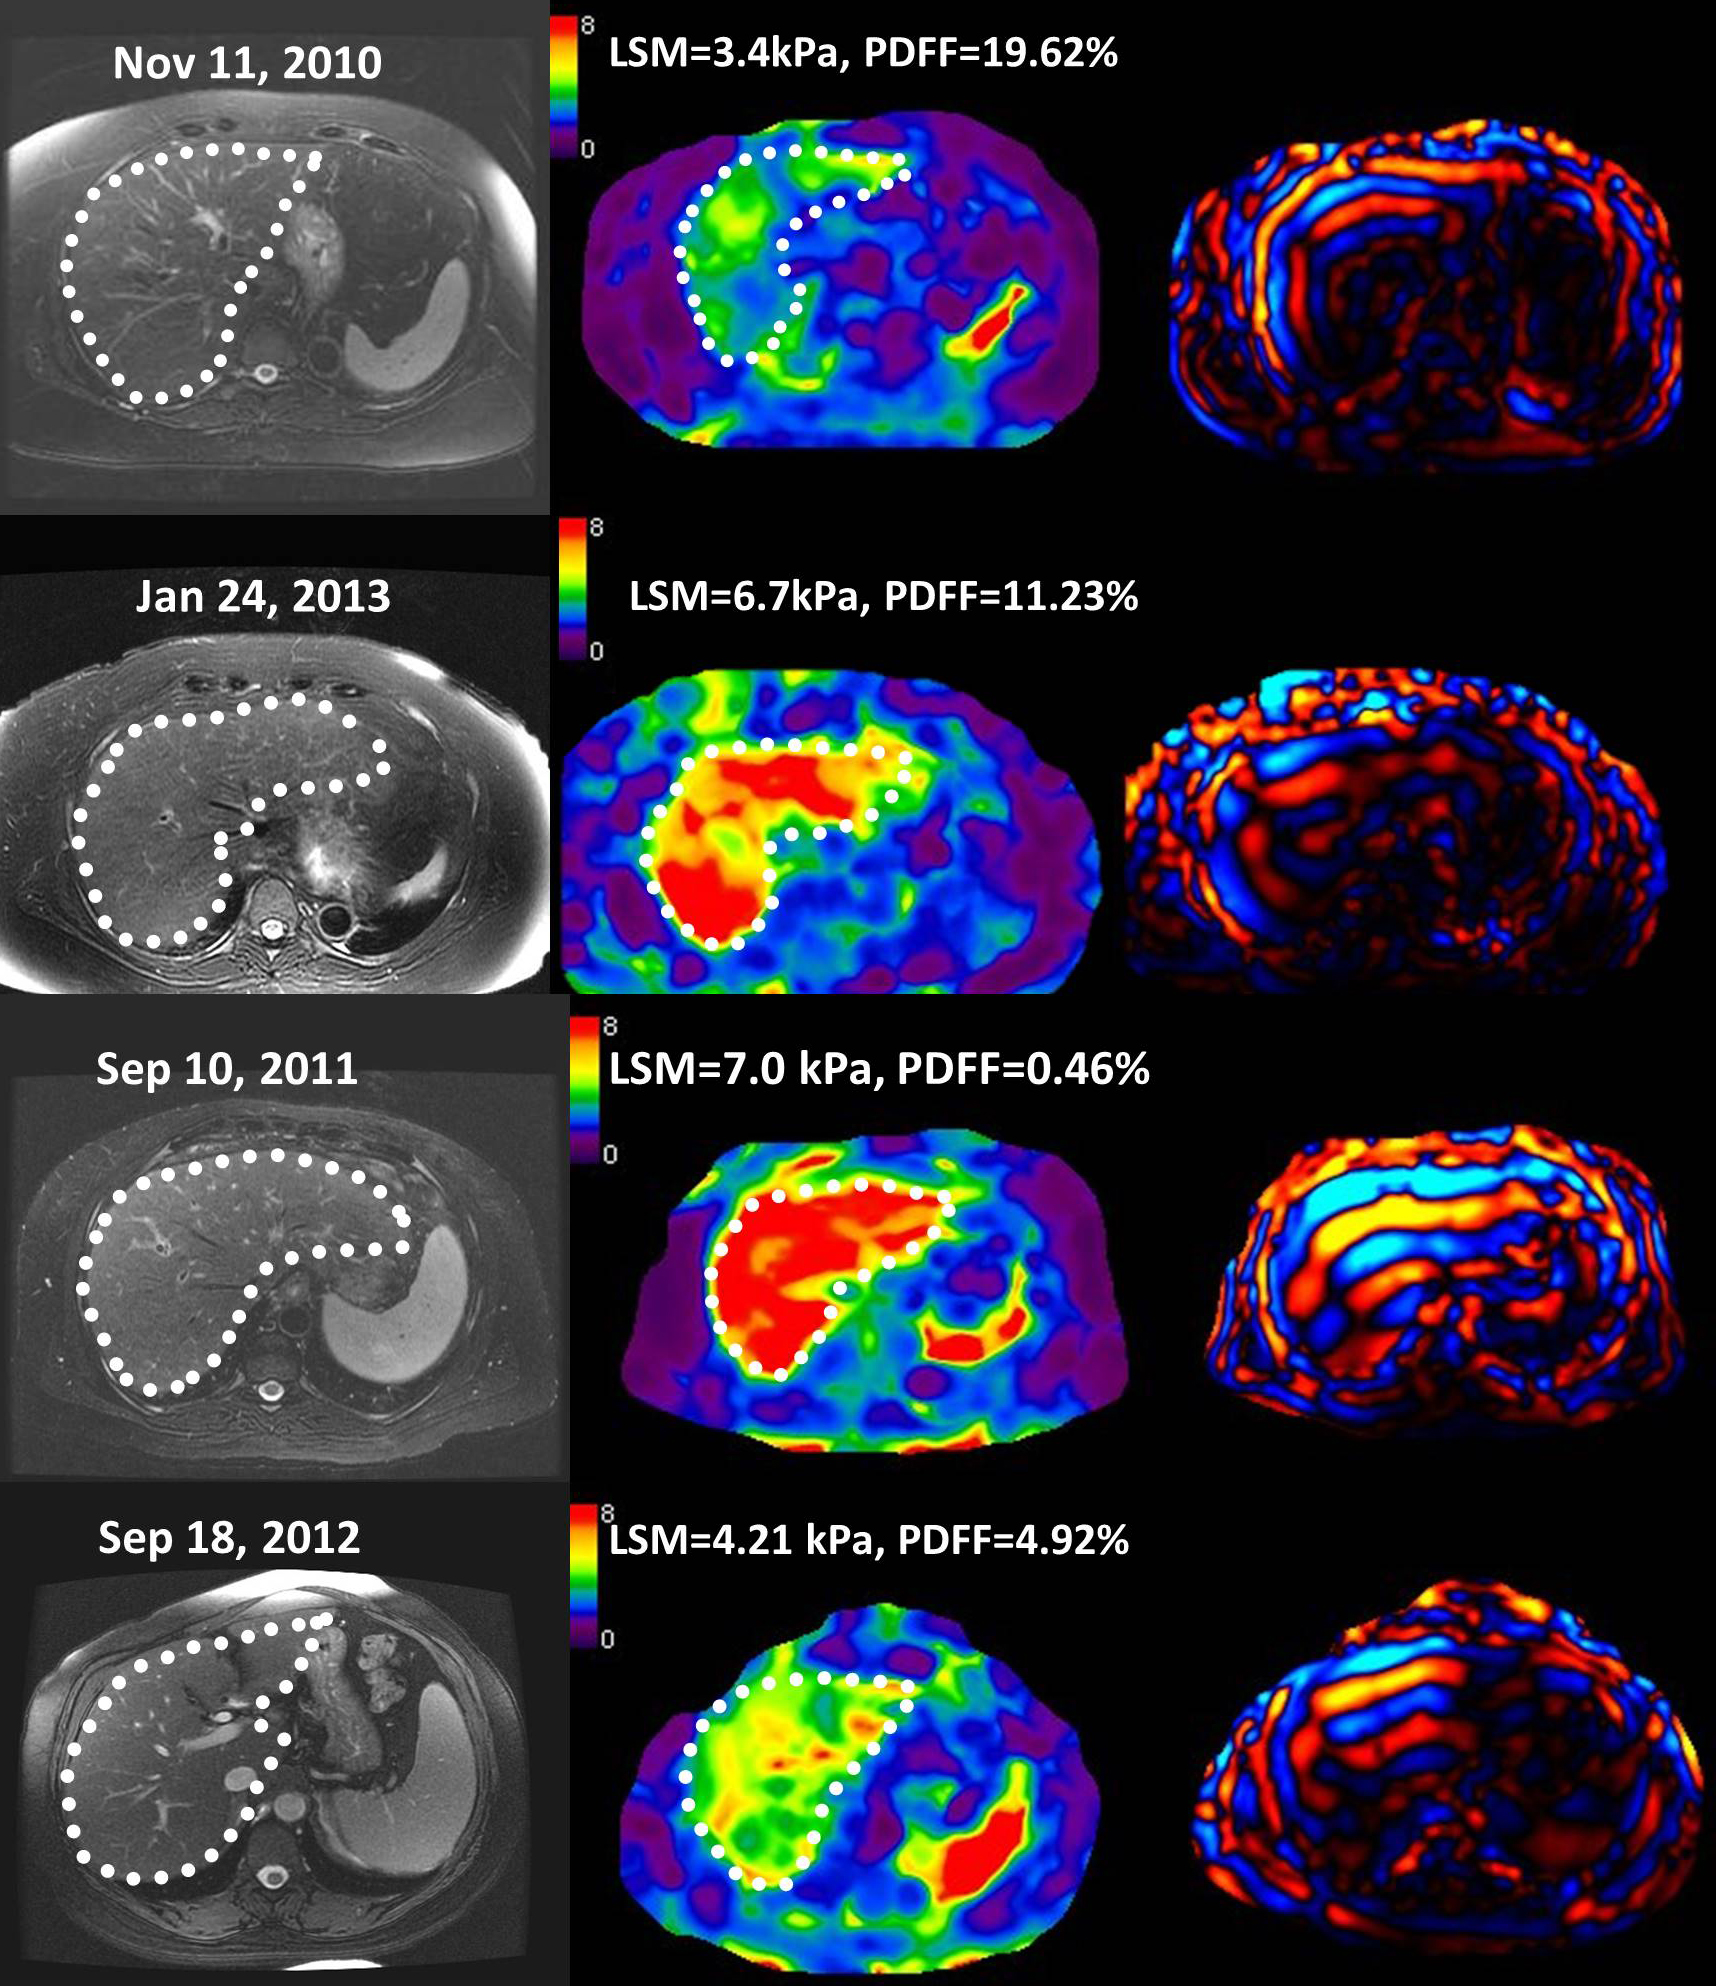
(Top) The T2WI/FS,
MRE elatograms, and wave image from 3 years of follow-up examinations of a 72-year-old
female with a noncirrhotic liver with typical small and positive changes in LSM,
her BMI increased from 31.5 to 35.0..
(Bottom) The T2WI/FS, MRE elatograms, and wave image in a 57 year-old female
with a cirrhotic liver with typical large and negative changes in LSM in one
year of follow-up examinations, her BMI increased from 28.7 to 31.1.