Jun Wang1, Wenjuan Bai2, Pengfei ZHANG1, Wenjing HUANG1, Wanjun HU1, Guangyao LIU1, and Jing ZHANG1
1Department of Magnetic Resonance, Lanzhou University Second Hospital, Lan Zhou, China, 2Second School of Clinical Medicine, Lanzhou University, Lan Zhou, China
1Department of Magnetic Resonance, Lanzhou University Second Hospital, Lan Zhou, China, 2Second School of Clinical Medicine, Lanzhou University, Lan Zhou, China
The microstructural integrity of white matter (WM) was evaluated using
automated fiber quantification tractography. AFQ demonstrated
early significant white matter attracts differences between T2DM and HC groups. And these parameters may be used to distinguish T2DM from HC.
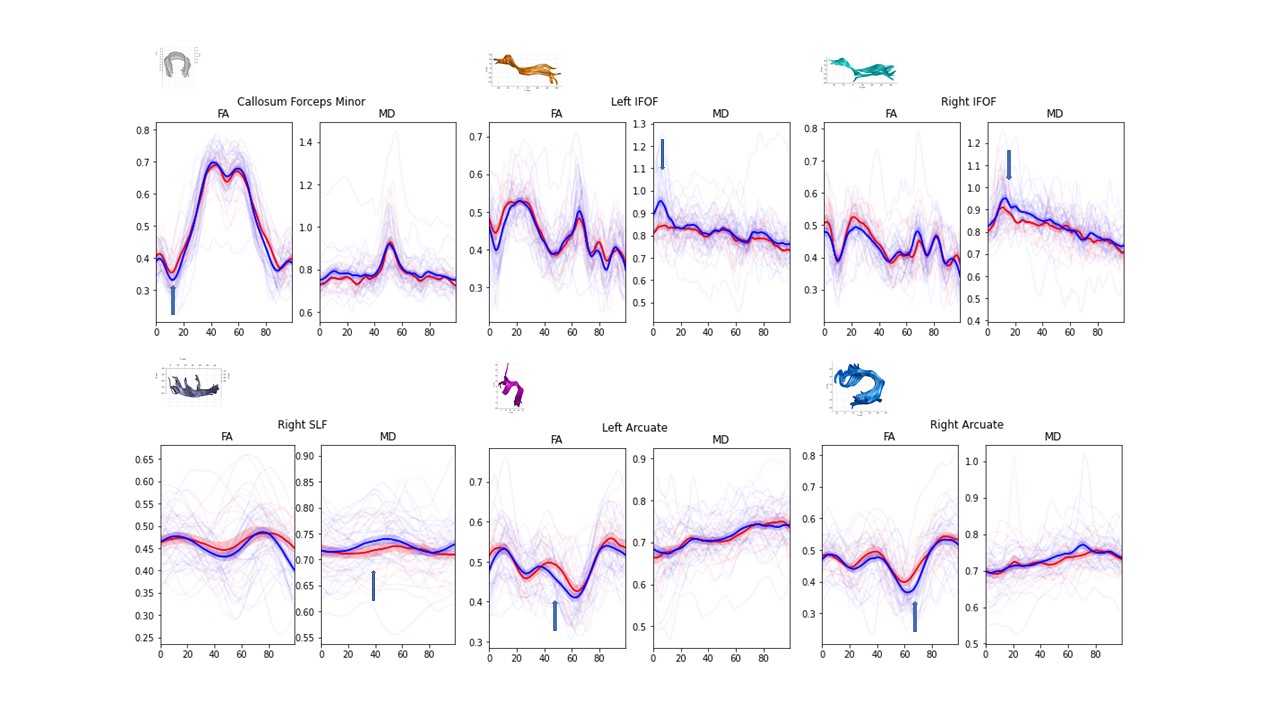
Fig. 1. Pointwise comparison of fractional anisotropy (FA) and mean diffusivity(MD) along the 20 WM tract among the type 2 diabetes (T2DM), and healthy controls (HC), which has a significant differences. The FA profiles are presented in mean ± standard deviation (SD). The red line stands for the T2DM , and blue for HC. The solid lines stand for the mean values and the shaded areas for SD. The horizontal axis indicates the location between the beginning and termination waypoint region of interest along the given tract. L (R), left (right) hemisphere.
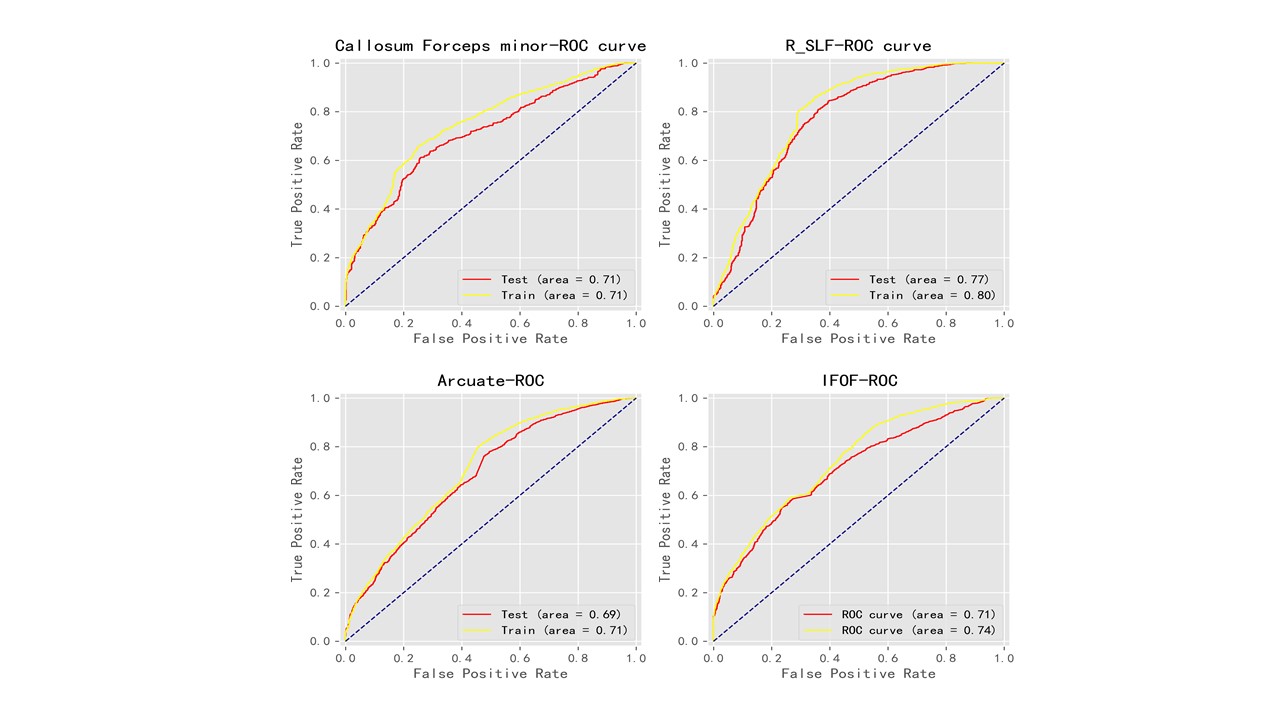
Fig. 3. The
receiver operating characteristic analysis of group classification using
support vector machine