Jason F. Moody1, Douglas C. Dean III1,2,3, Steven R. Kecskemeti 3, Sterling C. Johnson4,5, Barbara B. Bendlin4, and Andrew L. Alexander1,3,6
1Department of Medical Physics, University of Wisconsin Madison, Madison, WI, United States, 2Department of Pediatrics, University of Wisconsin-Madison, Madison, WI, United States, 3Waisman Center, University of Wisconsin Madison, Madison, WI, United States, 4Wisconsin Alzheimer’s Disease Research Center, University of Wisconsin Madison, Madison, WI, United States, 5Geriatric Research Education and Clinical Center, Middleton Memorial VA Hospital, University of Wisconsin-Madison, Madison, WI, United States, 6Department of Psychiatry, University of Wisconsin-Madison, Madison, WI, United States
1Department of Medical Physics, University of Wisconsin Madison, Madison, WI, United States, 2Department of Pediatrics, University of Wisconsin-Madison, Madison, WI, United States, 3Waisman Center, University of Wisconsin Madison, Madison, WI, United States, 4Wisconsin Alzheimer’s Disease Research Center, University of Wisconsin Madison, Madison, WI, United States, 5Geriatric Research Education and Clinical Center, Middleton Memorial VA Hospital, University of Wisconsin-Madison, Madison, WI, United States, 6Department of Psychiatry, University of Wisconsin-Madison, Madison, WI, United States
Age trajectories of MAP MRI parameters in WM reveal evidence for structurally
affected axons. RTOP and NG age trajectories
are significantly flatter in AD dementia subjects compared to healthy controls,
indicating these metrics could serve as markers for WM deterioration characteristic
of AD
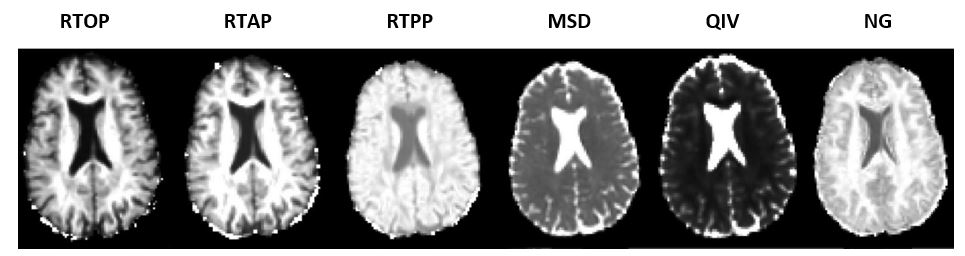
Figure 1 - Axial
views of MAP-MRI diffusion parameter maps in a healthy 60-year-old male. From
left to right: RTOP (mm-3), RTAP (mm-2), RTPP (mm-1),
MSD (mm2), QIV (mm5), and NG (dimensionless).
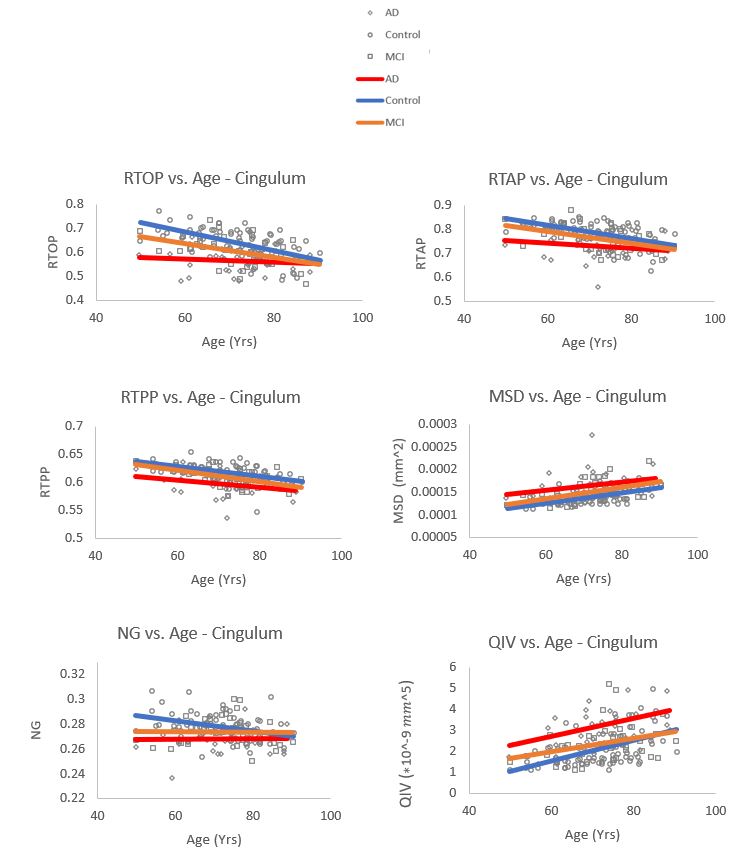
Figure 2– Average MAP Age trajectories extracted from the
cingulum for RTOP, RTAP, RTPP, MSD, NG, and QIV, with linear fits for the
control group (blue), MCI group (orange), and AD group (red).