Ilaria Ricchi1,2,3, Ricardo Corredor-Jerez1,2,3, Thierry Phénix4, Mélanie Leroy5, Reto Meuli2, Jonas Richiardi2, Bénédicte Maréchal1,2,3, and Jean-François Demonet4
1Advanced Clinical Imaging Technology, Siemens Healthcare AG, Lausanne, Switzerland, 2Dept. of Radiology, Lausanne University Hospital and University of Lausanne, Lausanne, Switzerland, 3LTS5, École Polytechnique Fédérale de Lausanne (EPFL), Lausanne, Switzerland, 4Leenaards Memory Centre CHUV Lausanne University, Lausanne, Switzerland, 5Lille Neuroscience & Cognition, Lille University, Inserm University Hospital CHU, Lille, France
1Advanced Clinical Imaging Technology, Siemens Healthcare AG, Lausanne, Switzerland, 2Dept. of Radiology, Lausanne University Hospital and University of Lausanne, Lausanne, Switzerland, 3LTS5, École Polytechnique Fédérale de Lausanne (EPFL), Lausanne, Switzerland, 4Leenaards Memory Centre CHUV Lausanne University, Lausanne, Switzerland, 5Lille Neuroscience & Cognition, Lille University, Inserm University Hospital CHU, Lille, France
Automated volumetry classifies AD and MCI patients from clinically normal (CN) subjects similarly to ATN classification, approximating in particular p-Tau biomarker, which represents alone a key feature for the classification.
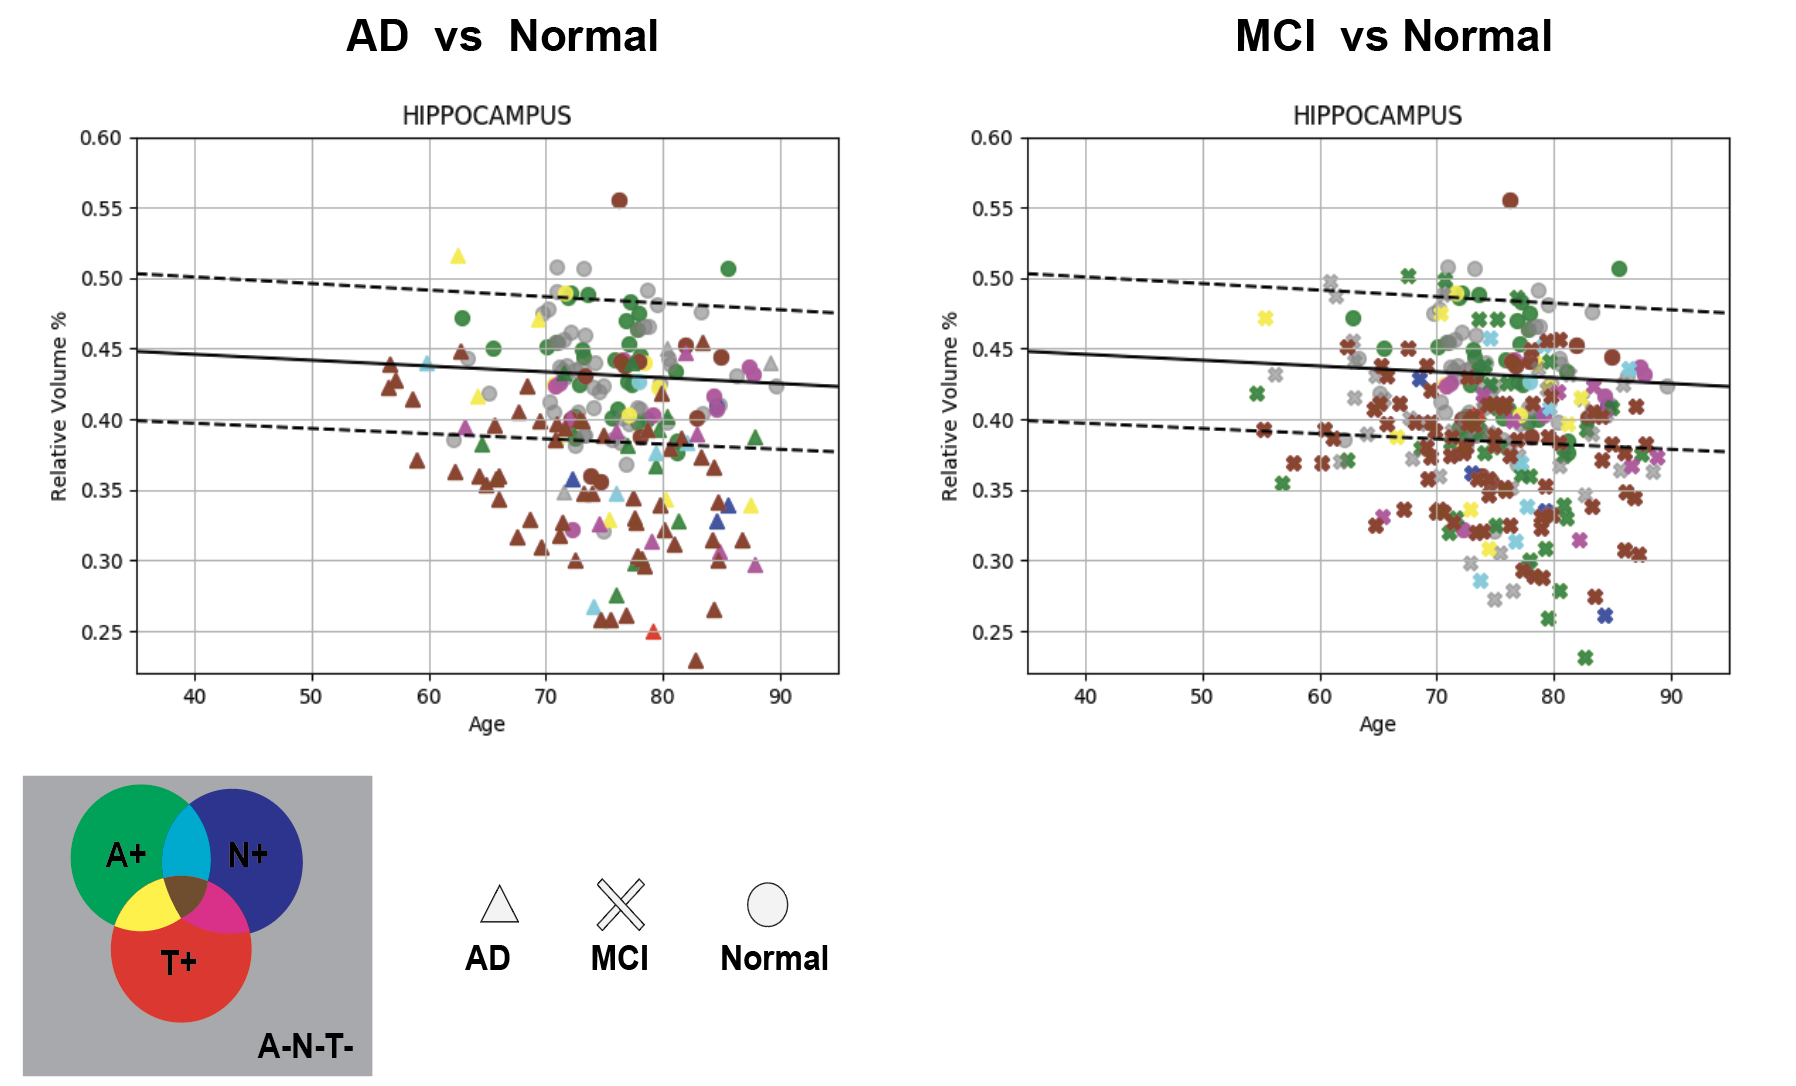
Figure 1. Relative volume distribution of hippocampal volume with respect to age. The lines indicate the 10th, 90th (dashed) and 50th (solid) percentiles for healthy controls [2]. The shapes of the scatter plot represent the clinical diagnosis (AD,MCI, normal) and the color represent the ATN classification.
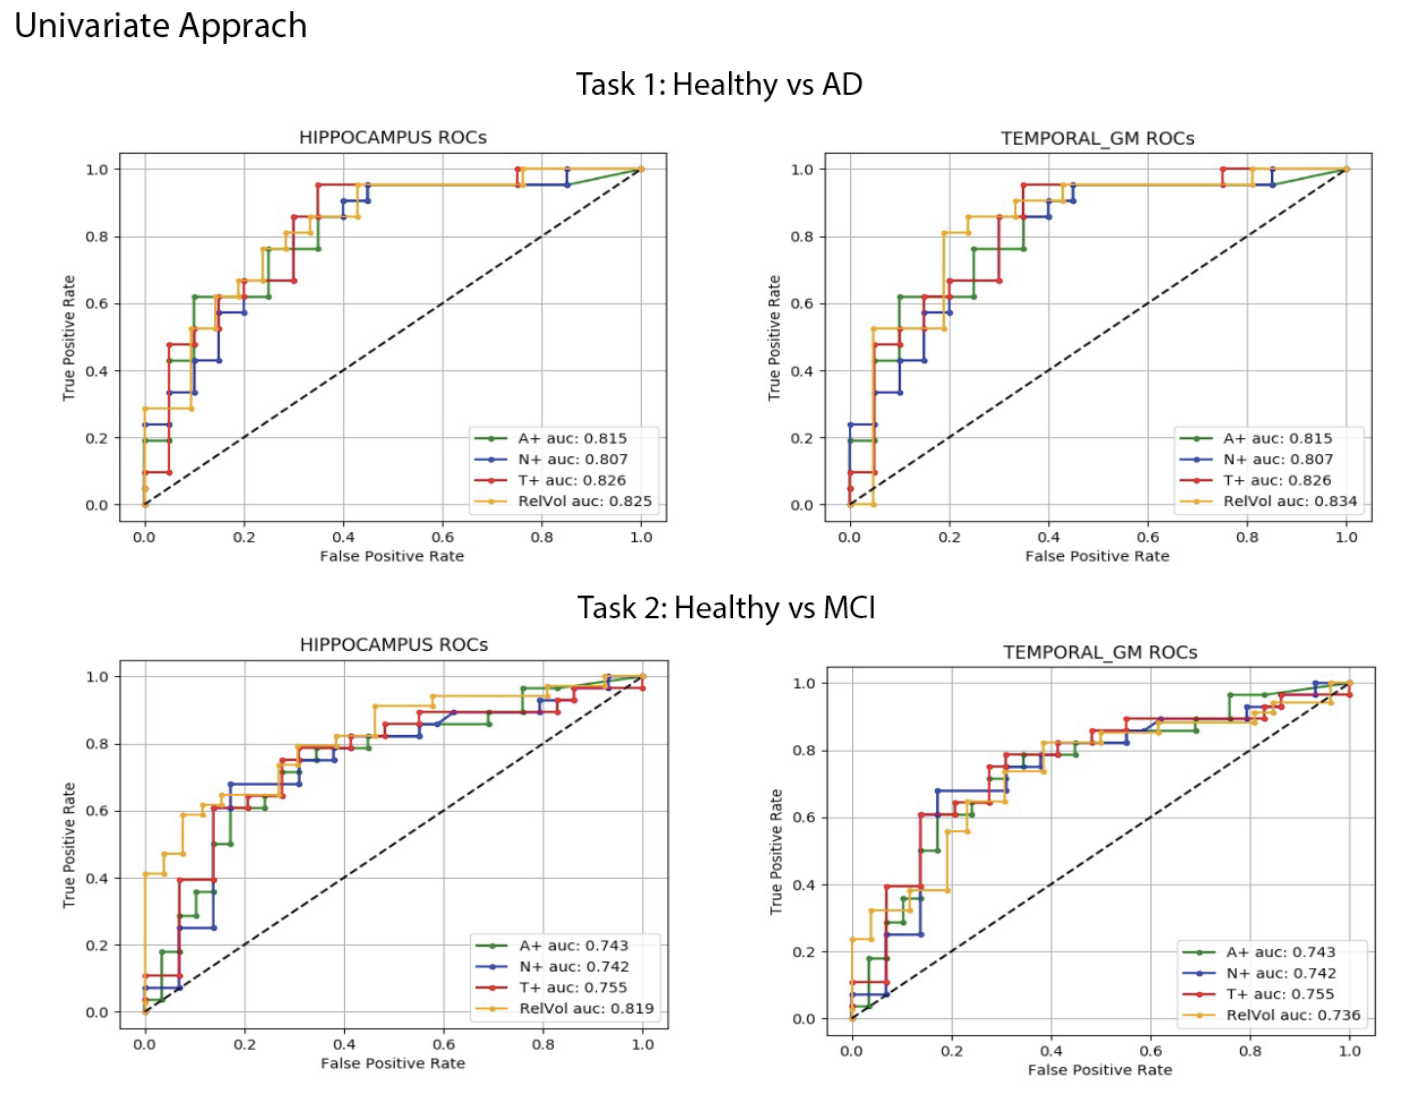
Figure 2. ROC curves of the univariate approach using hippocampus and temporal GM relative volumes (in orange) with respect to Aβ42 (green), pTau (red), and Tau (blue). The logistic regression best hyperparameters were: L2 regularization with a coefficient C=0.001, without weighting the classes.