Xiaoqing Alice Zhou1, Grace Ngiam1, Lei Qian2, Tammy Sankorrakul3, Elizabeth J Coulson2, and Kai-Hsiang Chuang4
1QBI/SBMS, The University of Queensland, Brisbane, Australia, 2SBMS/QBI, The University of Queensland, Brisbane, Australia, 3SBMS, The University of Queensland, Brisbane, Australia, 4QBI/CAI, The University of Queensland, Brisbane, Australia
1QBI/SBMS, The University of Queensland, Brisbane, Australia, 2SBMS/QBI, The University of Queensland, Brisbane, Australia, 3SBMS, The University of Queensland, Brisbane, Australia, 4QBI/CAI, The University of Queensland, Brisbane, Australia
TBM analysis revealed a significant volume decrease in medial septum (MS) and substantia innominate (SI). However, the MRI-detected volume changes in the basal forebrain is not associated with cholinergic neurons in 3xTg-AD animals.
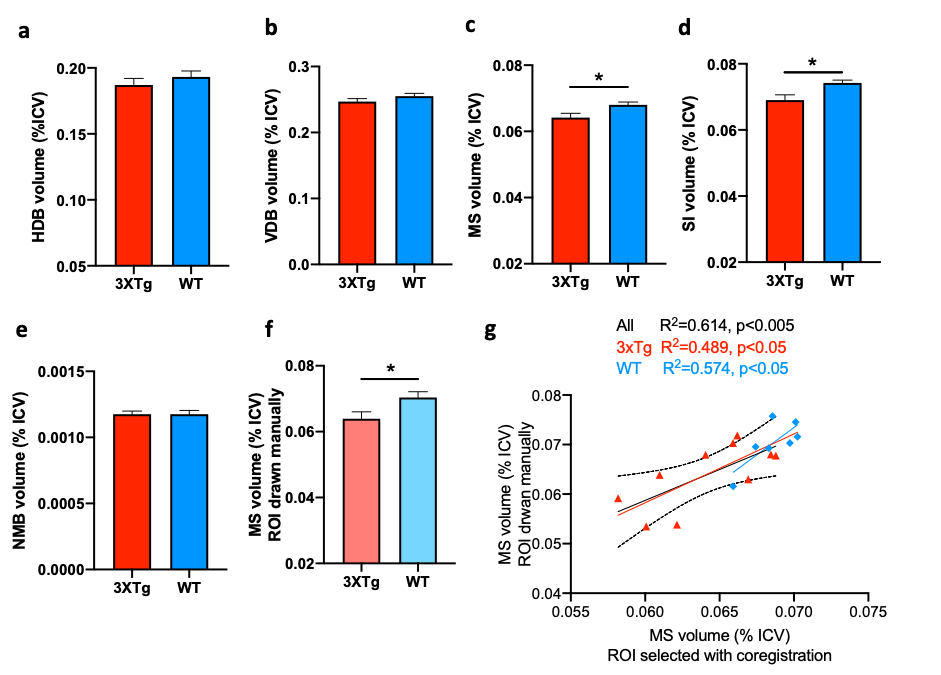
Figure 2. 3xTg mice have smaller basal forebrain volume. (a-e) Automated image registration-based quantification of the basal forebrain volume of control and 3xTg mice. (f) Manually drawn ROI showed decreased MS volume in 3xTG mice. (g) The automated image registration-based quantification and manual ROI quantification show significant correlation. MS, medial septum; SI, substantia innominate; HDB, the horizontal limb of the diagonal band of Broca; VDB, vertical diagonal band nucleus; BNM, basal nucleus of Meynert. Data are shown in mean ± SEM, *P<0.05.
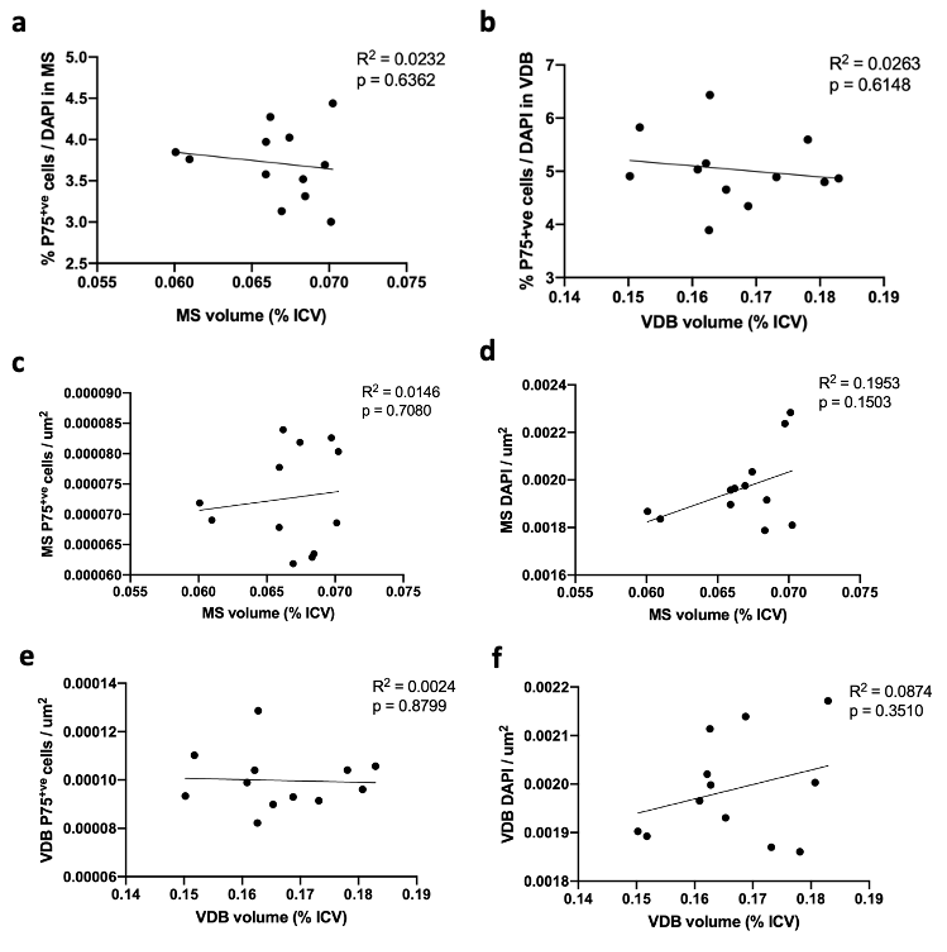
Figure 5. Correlation between MRI-detected volume and cholinergic cell proportion and density. (a-f) Simple linear regression of MRI volume of MS and VDB, as represented by the proportion of intracranial volume (% ICV), plotted against p75 positive cell proportion (n=12, p>0.05).