Dana Goerzen1,2, Caitlin Fowler1,2, Dan Madularu3, Gabriel A Devenyi2, M. Mallar Chakravarty1,2, and Jamie Near1,2
1McGill University, Montreal, QC, Canada, 2Centre d'Imagerie Cérébrale, Douglas Mental Health University Institute, Montreal, QC, Canada, 3Center for Translational Neuroimaging, Northeastern University, Boston, MA, United States
1McGill University, Montreal, QC, Canada, 2Centre d'Imagerie Cérébrale, Douglas Mental Health University Institute, Montreal, QC, Canada, 3Center for Translational Neuroimaging, Northeastern University, Boston, MA, United States
For the first time, longitudinal changes in 71 unique brain regions were characterized in aging male and female Fischer rats, contributing to our understanding of baseline neuroanatomical changes associated with healthy aging in both sexes.
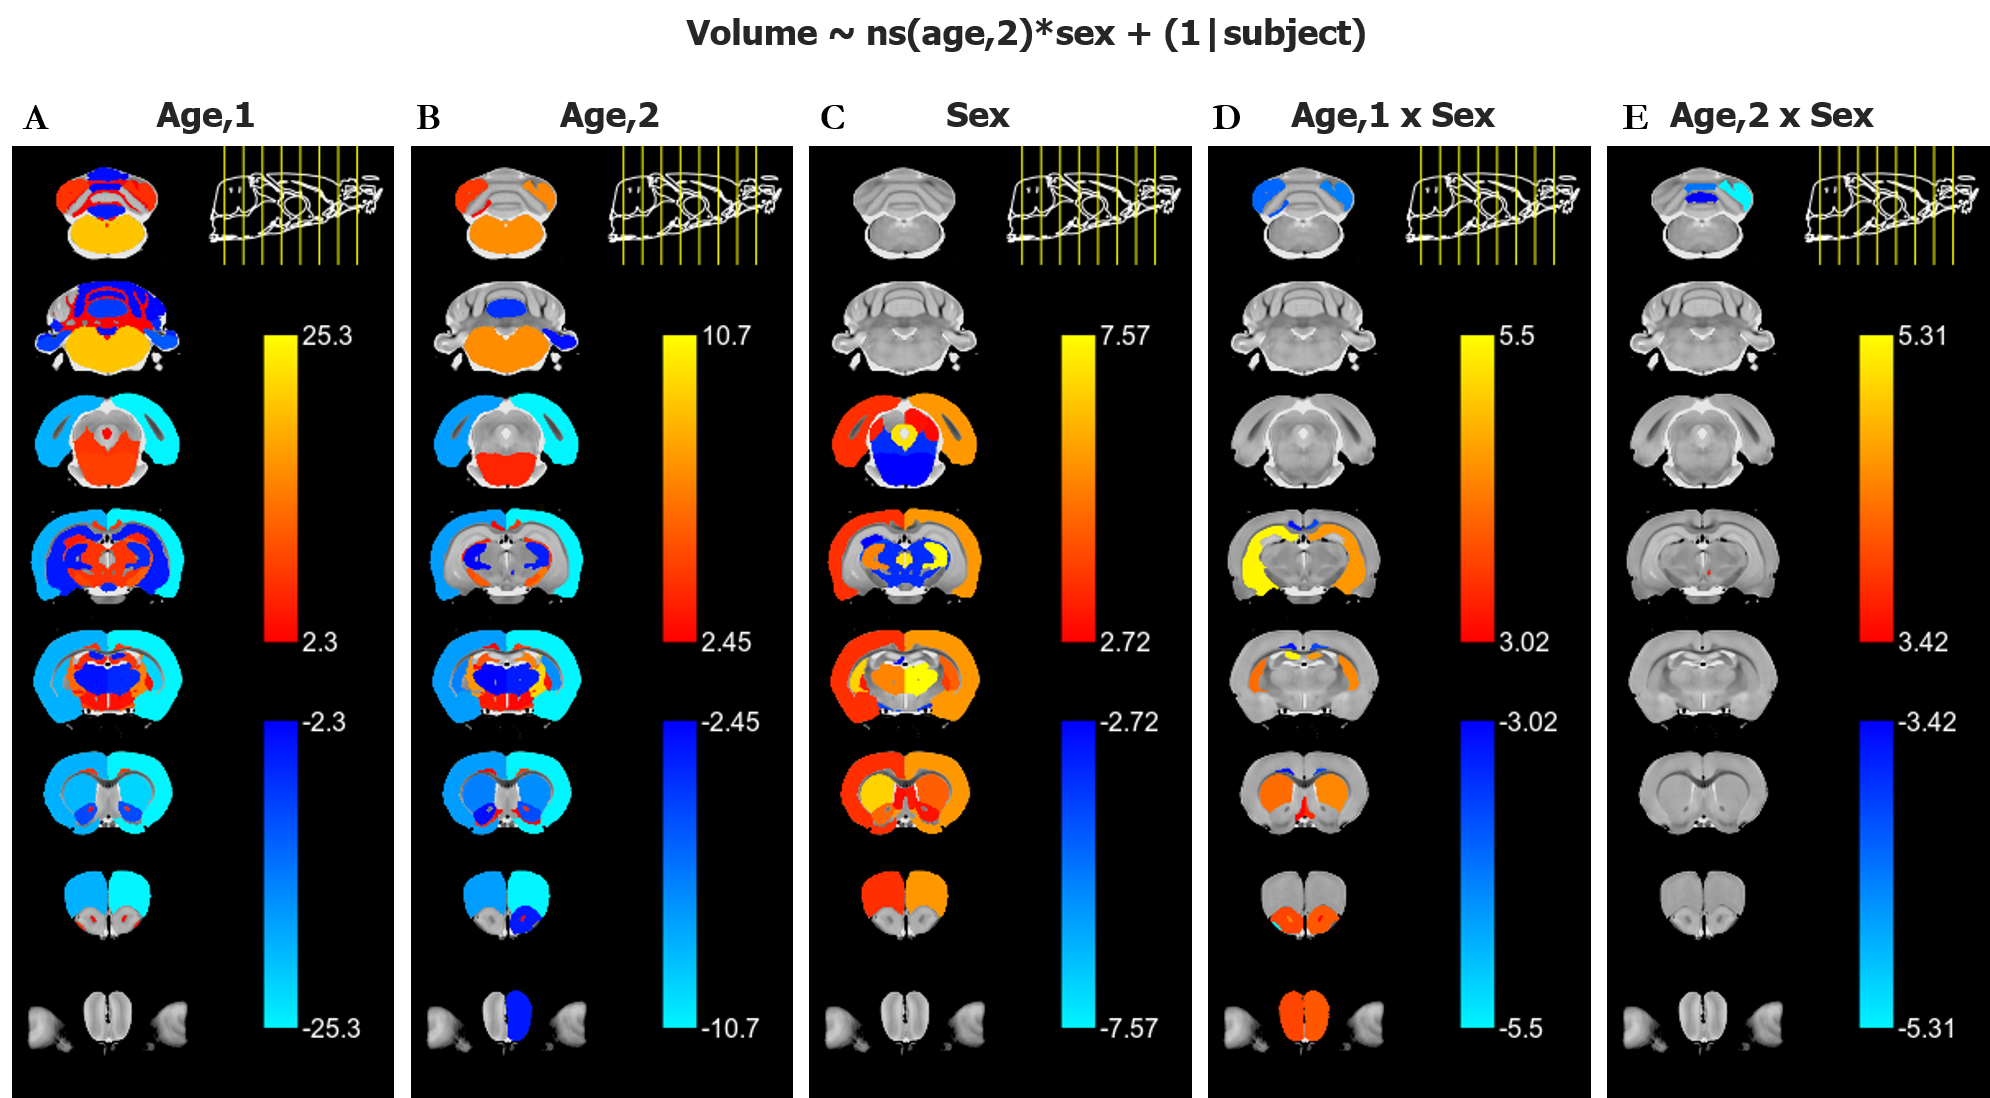
Figure 2. Regional linear model of relative volume=ns(age,2)*sex+(1|subject) with columns A-E corresponding to different model terms. Each regional t-value for each model term is mapped to the corresponding atlas label and overlaid onto the anatomical average image as a regional t-value heatmap. Only regions with statistics that surpass a 5% FDR correction are plotted and the upper bound of the scale corresponds to the maximal t-value modeled by that term. t-value scale is shown for each term.
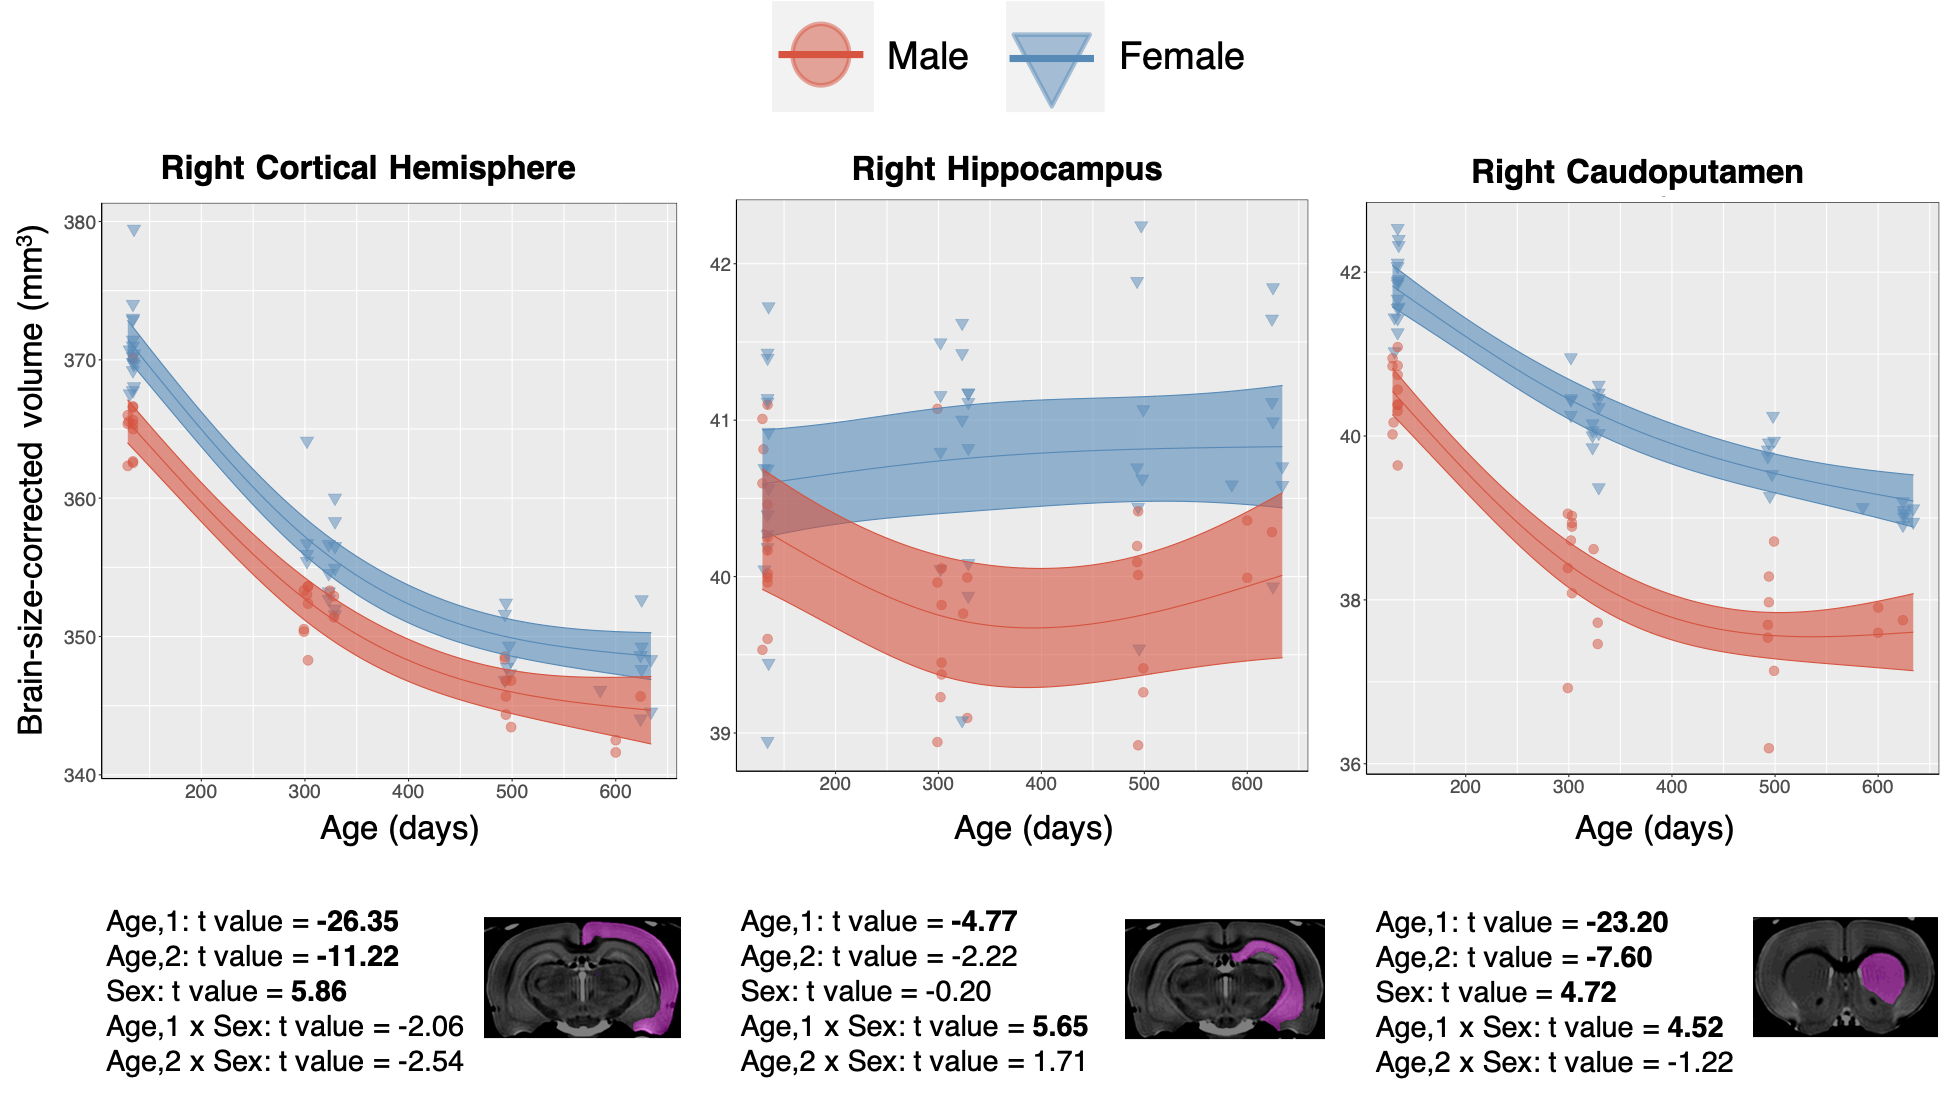
Figure 3. Data from selected grey matter regions is shown with individual data points shown and the overall model as with confidence interval as described in Methods overlaid. T-values for each region and model term are shown on bottom, with significant terms after 5% FDR correction given in bold.