Martyna Dziadosz1, Maike Hoefemann1, André Döring2, Malgorzata Marjanska3, Edward Auerbach3, and Roland Kreis1
1Departments of Radiology and Biomedical Research, University of Bern, Bern, Switzerland, 2Cardiff University Brain Research Imaging Centre (CUBRIC), School of Psychology, Cardiff University, Cardiff, United Kingdom, 3Department of Radiology, Center for Magnetic Resonance Research, University of Minnesota, Minnesota, MN, United States
1Departments of Radiology and Biomedical Research, University of Bern, Bern, Switzerland, 2Cardiff University Brain Research Imaging Centre (CUBRIC), School of Psychology, Cardiff University, Cardiff, United Kingdom, 3Department of Radiology, Center for Magnetic Resonance Research, University of Minnesota, Minnesota, MN, United States
In this study we compare three techniques
to access NAD+ quantification – standard WS semiLASER and two nWS(MC semiLASER
and 2D I-CSE). NAD+ was detected with all techniques with a limited visibility for
the WS semiLASER. While utilizing nWS concept allows to detect NAD+ at the visibility
of 66%.
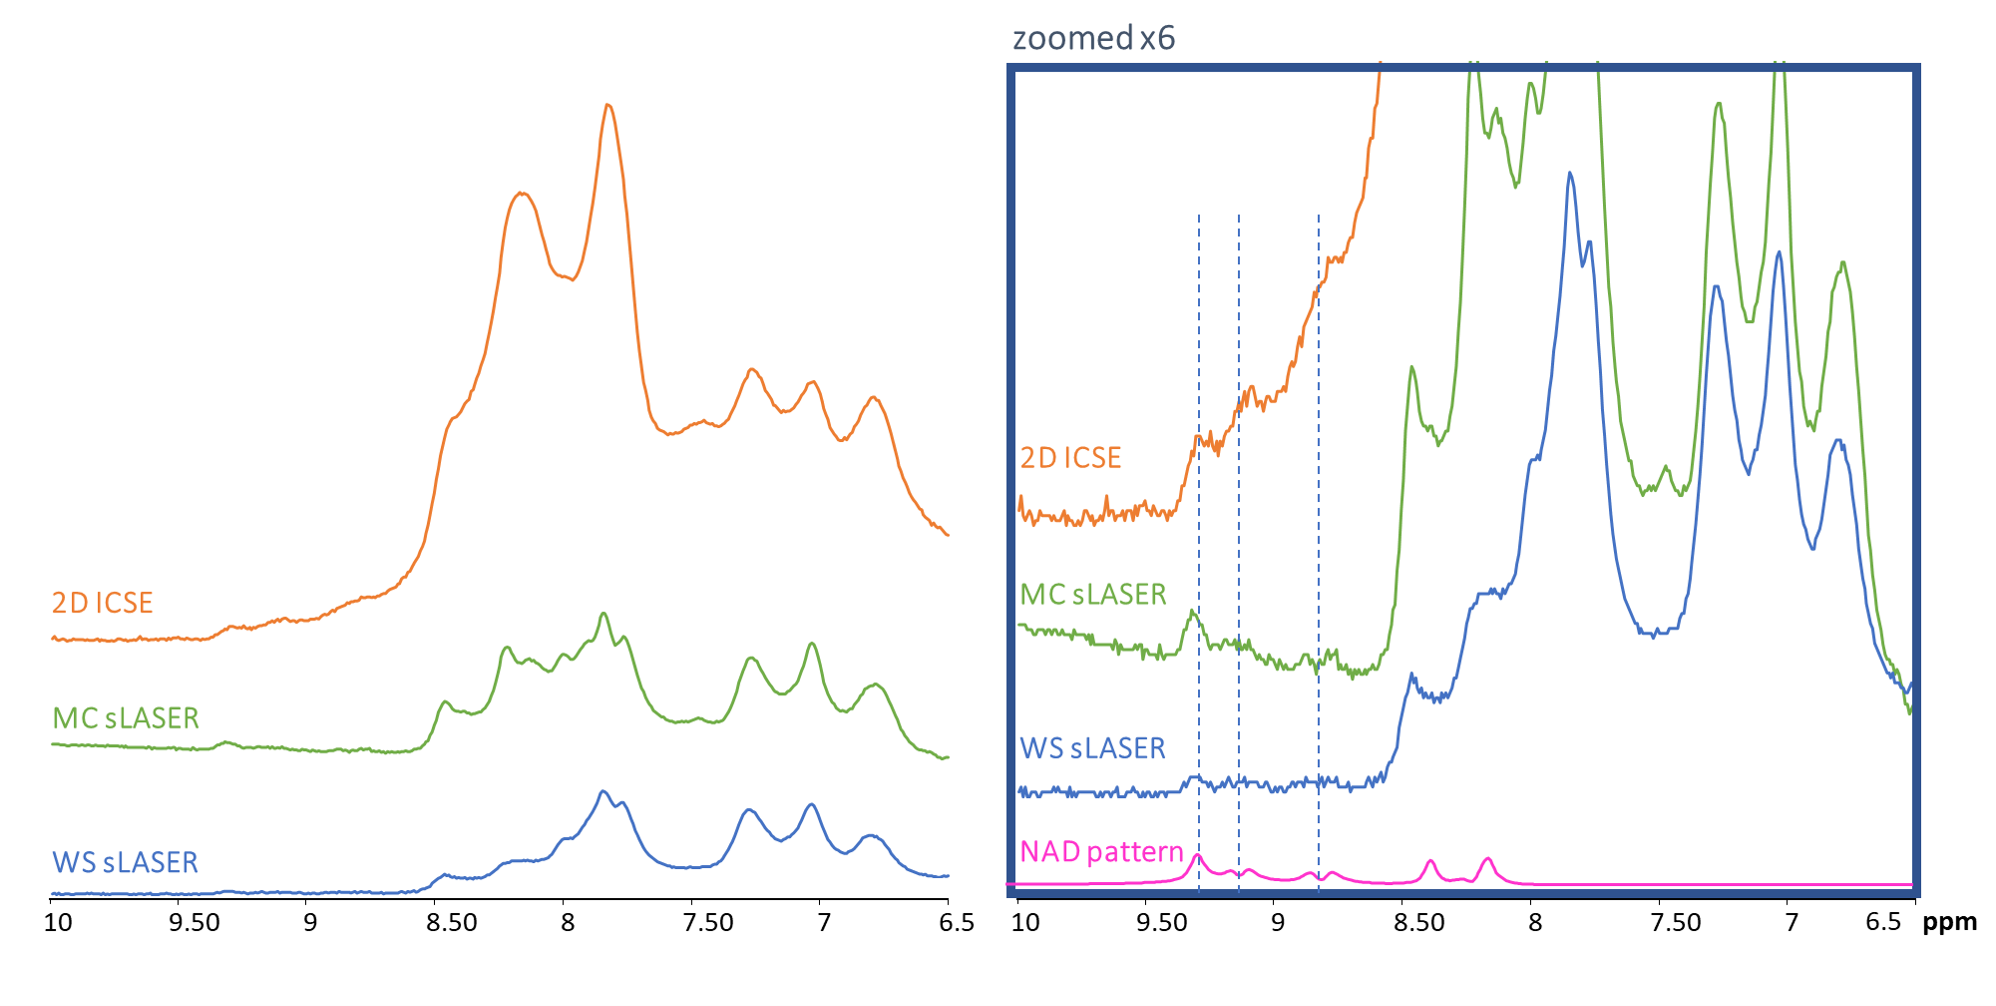
Fig 2. Cohort-averaged downfield spectra from 10
subjects each, plotted in the range between 6.5 and 10 ppm. The cohort averages
were formed after scaling by unsuppressed water to assure equal weight for each
subject. Appropriate scaling was also applied to guarantee a comparable scale
between techniques. For better visibility of the NAD+ signals
spectra are plotted with 6x vertical scale on the right-hand side along with
the simulated NAD+ pattern (peaks at 8.2 and 8.4 ppm removed to
minimize interference with larger overlapping signals). Dashed lines indicate
the NAD+ peaks fitted.
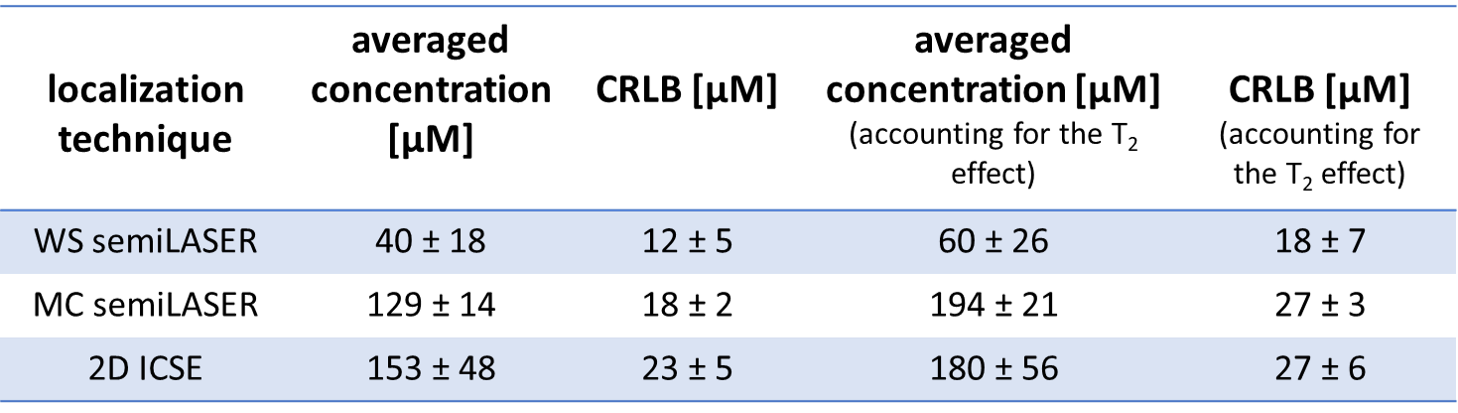
Table 1. NAD+ concentrations and Cramer Rao lower
bounds and their cohort standard deviations (SD) as obtained with all three
localization techniques, without and with correction for T2
relaxation with an assumed T2 of 80 ms (assumption based on Ref 12
reporting 54±5 ms at 11.7 T). For a fair comparison considering equal scan times
for all methods, the CRLB for MC semiLASER and 2D ICSE should be reduced by 30%,
which yields almost the same CRLB for both semiLASER approaches.