Theresia Ziegs1,2, Andrew Martin Wright1,2, and Anke Henning1,3
1MRZ, MPI for Biological Cybernetics, Tuebingen, Germany, 2IMPRS for Cognitive and Systems Neuroscience, Tuebingen, Germany, 3Advanced Imaging Research Center, University of Texas Southwestern Medical Center, Dallas, TX, United States
1MRZ, MPI for Biological Cybernetics, Tuebingen, Germany, 2IMPRS for Cognitive and Systems Neuroscience, Tuebingen, Germany, 3Advanced Imaging Research Center, University of Texas Southwestern Medical Center, Dallas, TX, United States
Fully sampled 1H FID MRSI data were acquired at
9.4 T. An optimized processing pipeline lead to high quality concentration maps for tCr, tCho, NAA, Glu,
and mI reflecting the expected concentration difference in gray and white
matter for the major part of the brain.
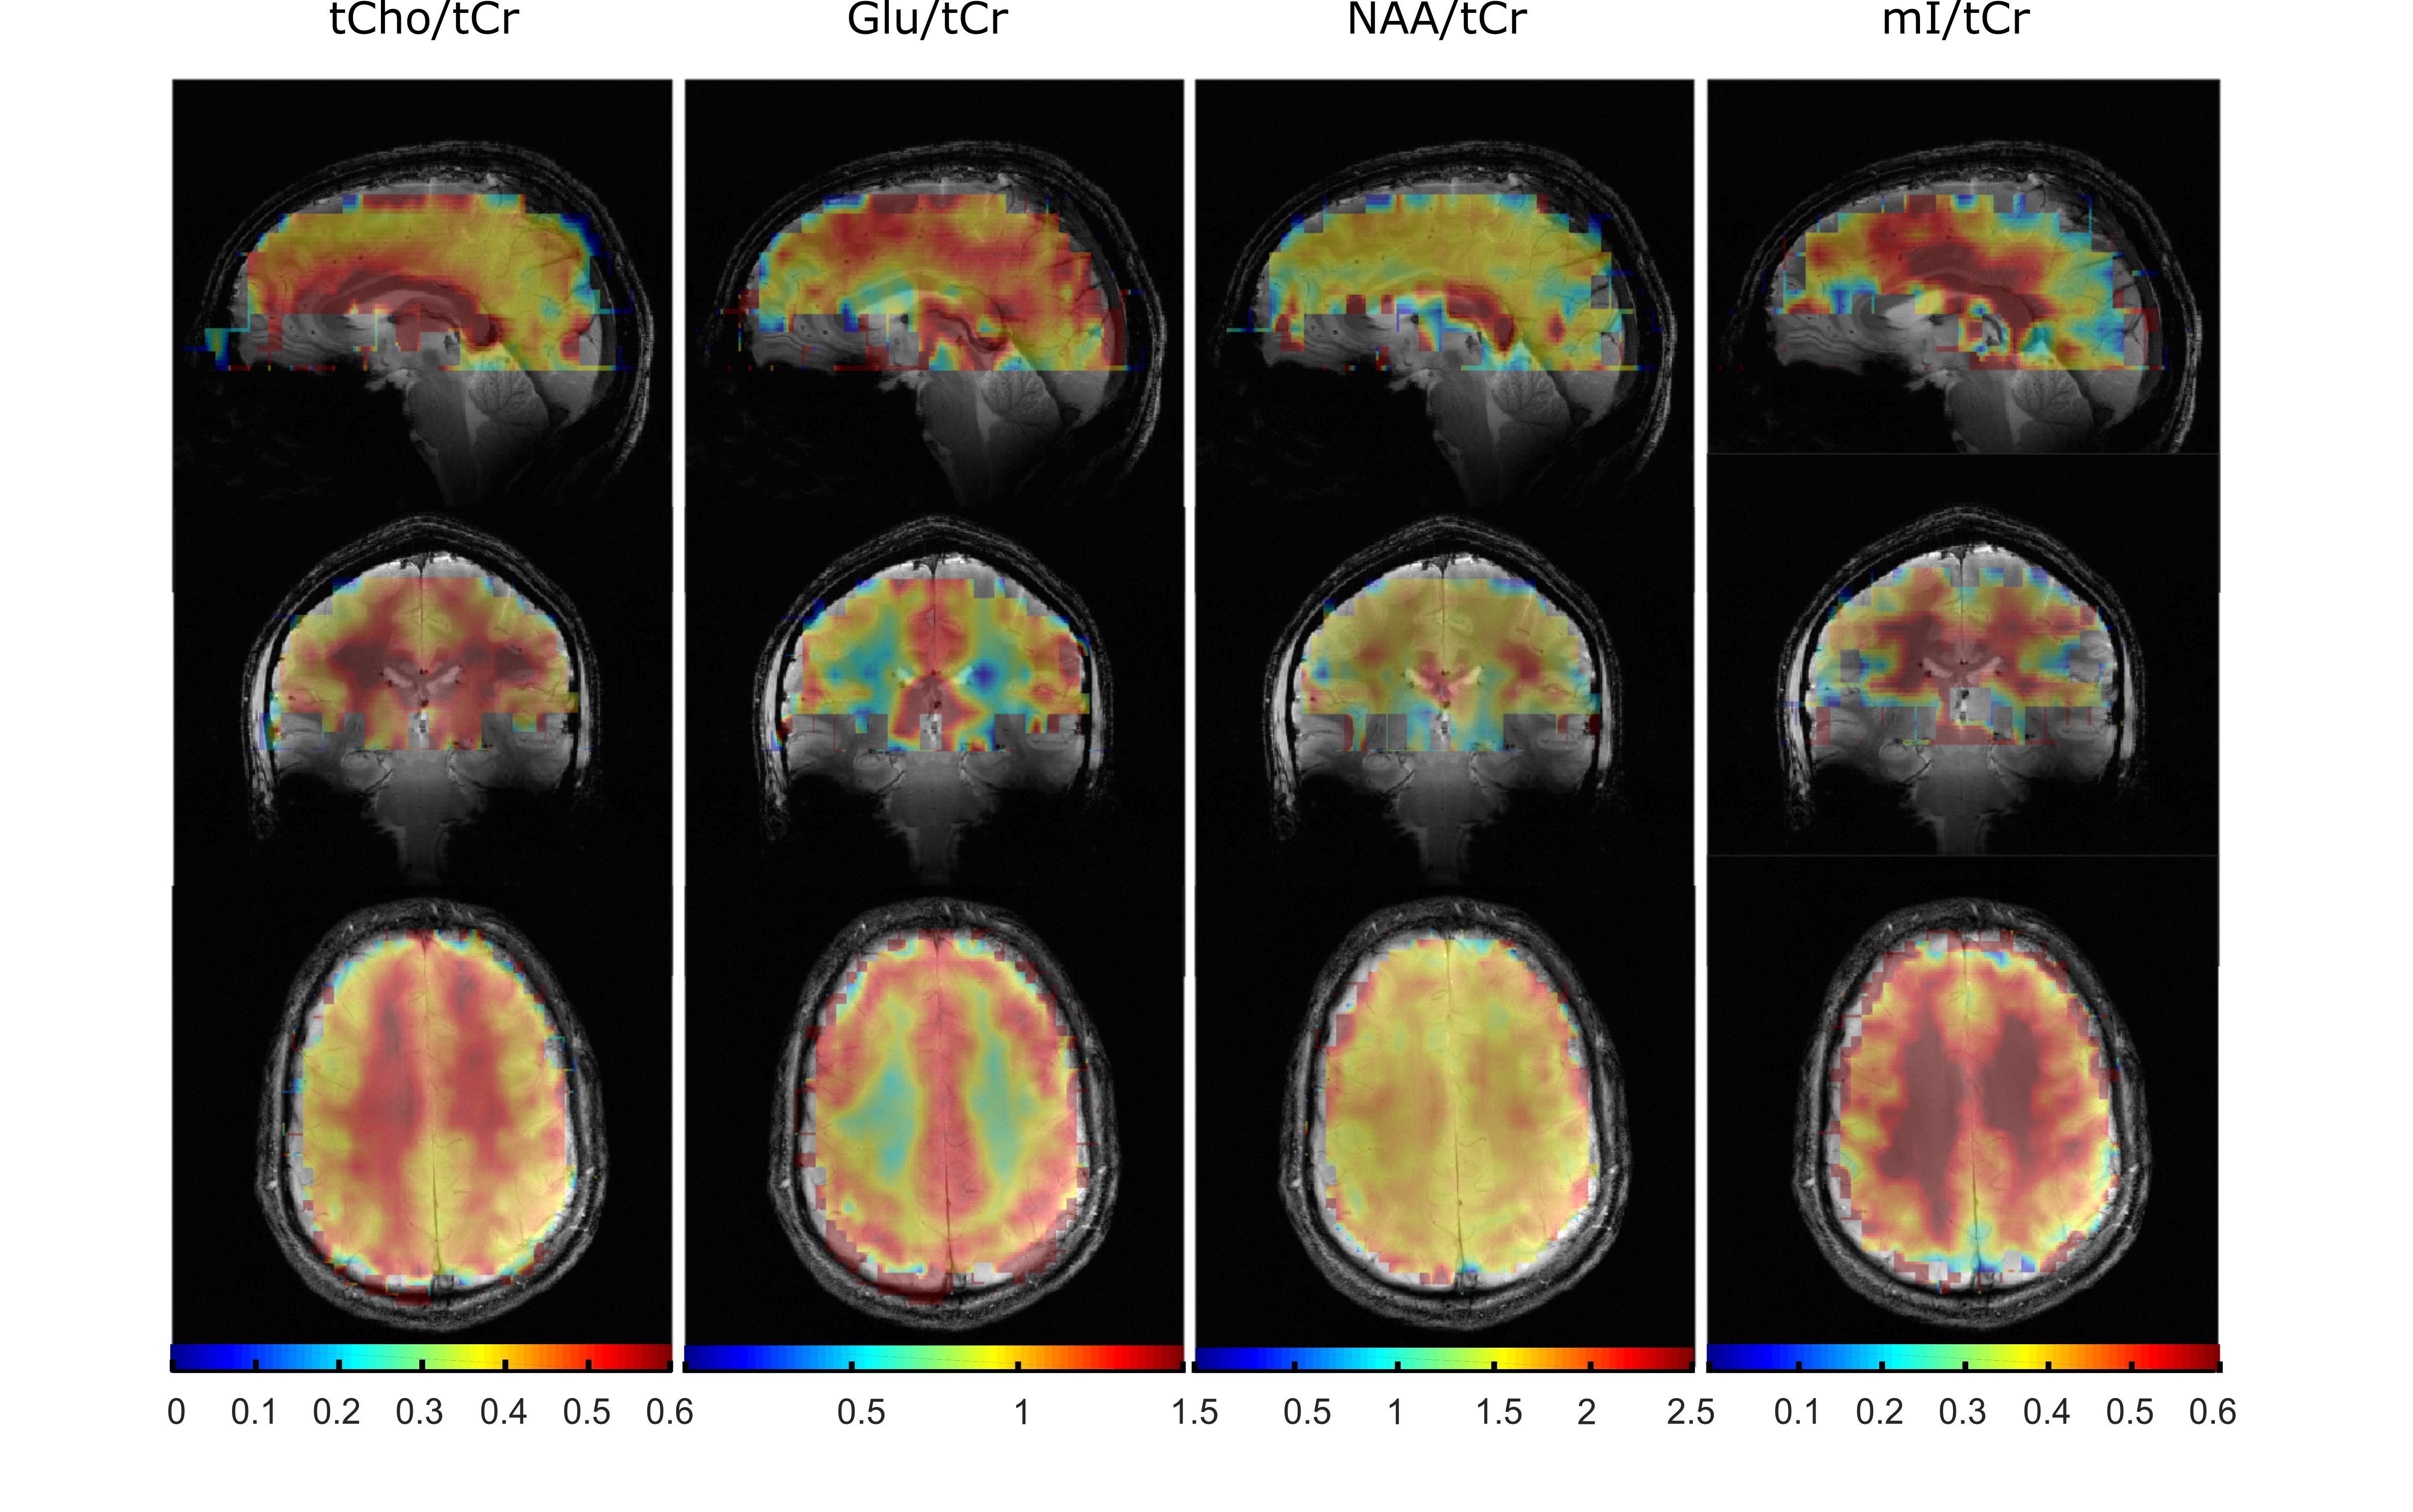
Figure 4: 3D concentration maps for tCho/tCr,
Glu/tCr, NAA/tCr, mI/tCr in arbitrary units showing the brain coverage achieved
in this study with the optimized set-up using L2-regularization and including a
simulated macromolecular baseline in the LCModel fit. The metabolite maps are
underlayed with the anatomical images.
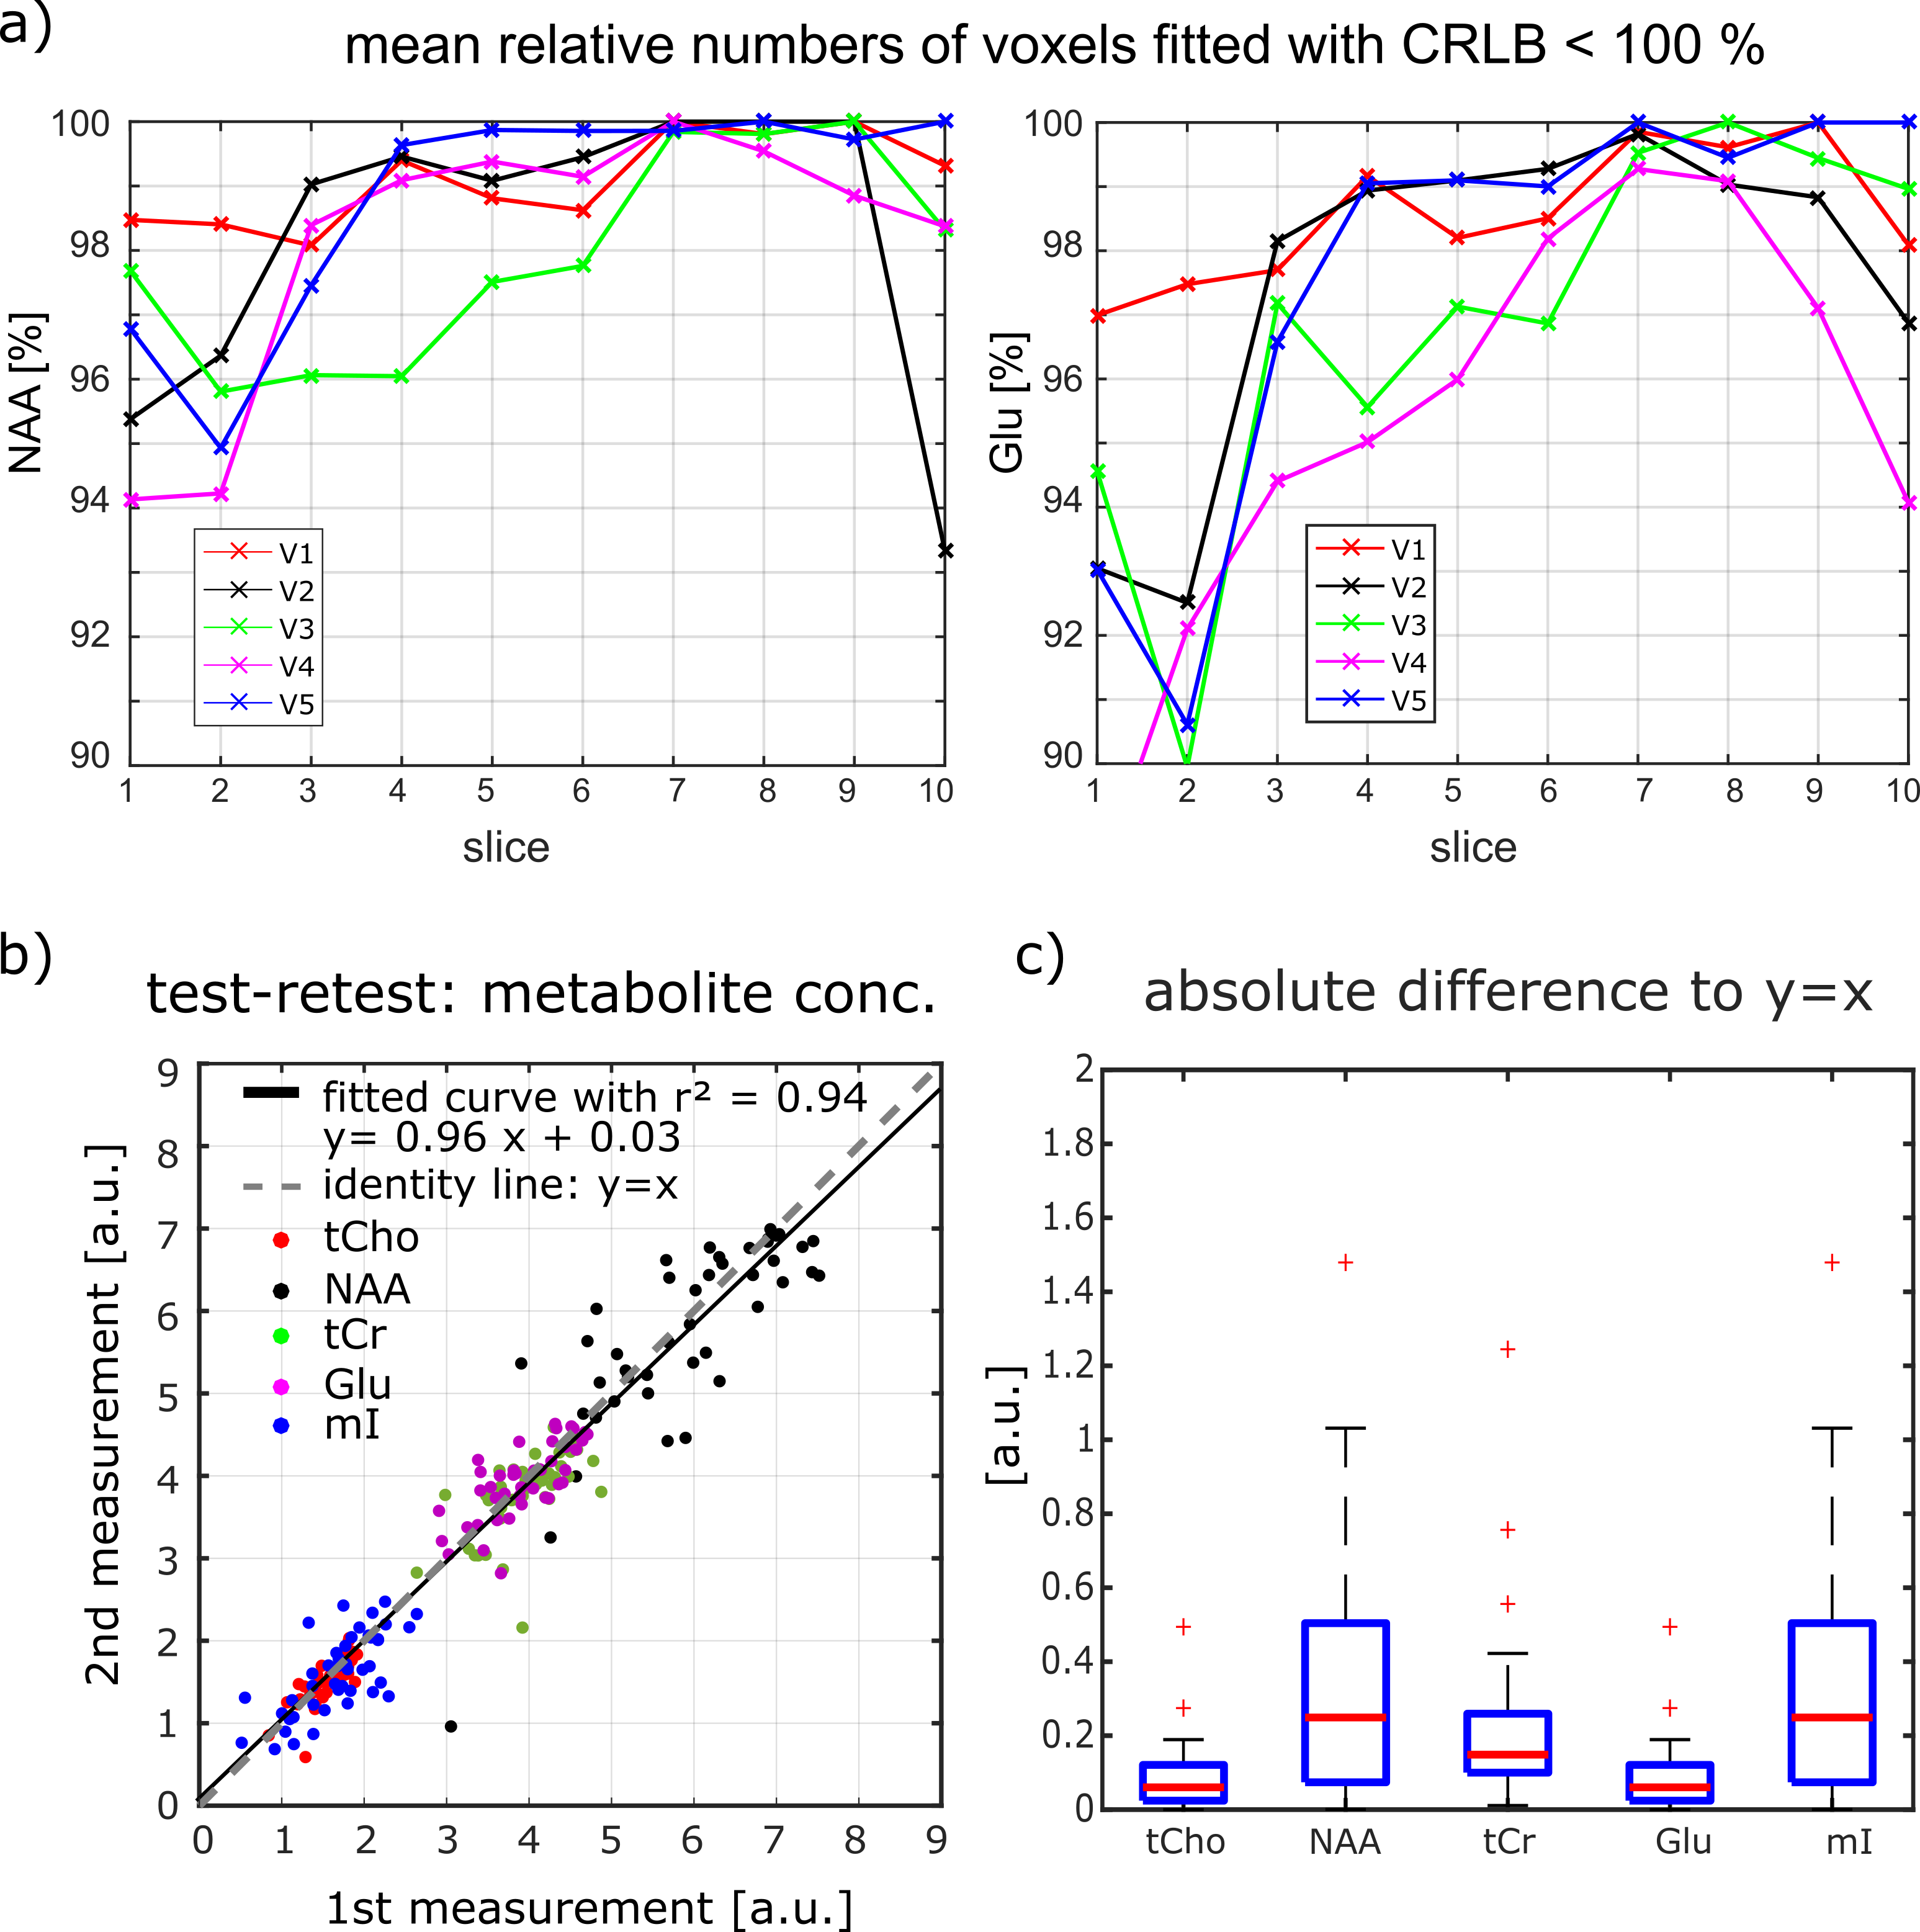
Figure 5: Mean number of voxels fitted
with CRLB < 100 % for each slice for NAA and Glu for one measurement of all
volunteers. The test-retest figure in b) shows the mean concentration for each
slice. Data is shown for all five volunteers and five different metabolites
(Cho = red dots, NAA = black dots, tCr = green dots, Glu = purple dots, mI =
blue dots). The black line is the curve fitted to the data with y = 0.96x +
0.03 and r2 = 0.94; the gray dotted line is the identity line with y = x. In c)
the absolute difference of the dots in the test-retest figure to the ideal case
of y = x is shown for five metabolites.