Brigitte Schweisthal1, Federico Turco1, Raphael Meier1, Irena Zubak2, and Johannes Slotboom1
1Neuroradiology / Support Center for Advanced Neuroimaging (SCAN), University Hospital and Inselspital, University Bern, Bern, Switzerland, 2Neurosurgery, University Hospital and Inselspital, University Bern, Bern, Switzerland
1Neuroradiology / Support Center for Advanced Neuroimaging (SCAN), University Hospital and Inselspital, University Bern, Bern, Switzerland, 2Neurosurgery, University Hospital and Inselspital, University Bern, Bern, Switzerland
This work deals with quantification of clinical
1H-MRSI data using machine learning. RF-regressors
were determined based on 10000 simulated TD & FD responses obeying a prior
knowledge model. RF-regression is a valid alternative for quantification with comparative accuracy as NLLS-fitting.
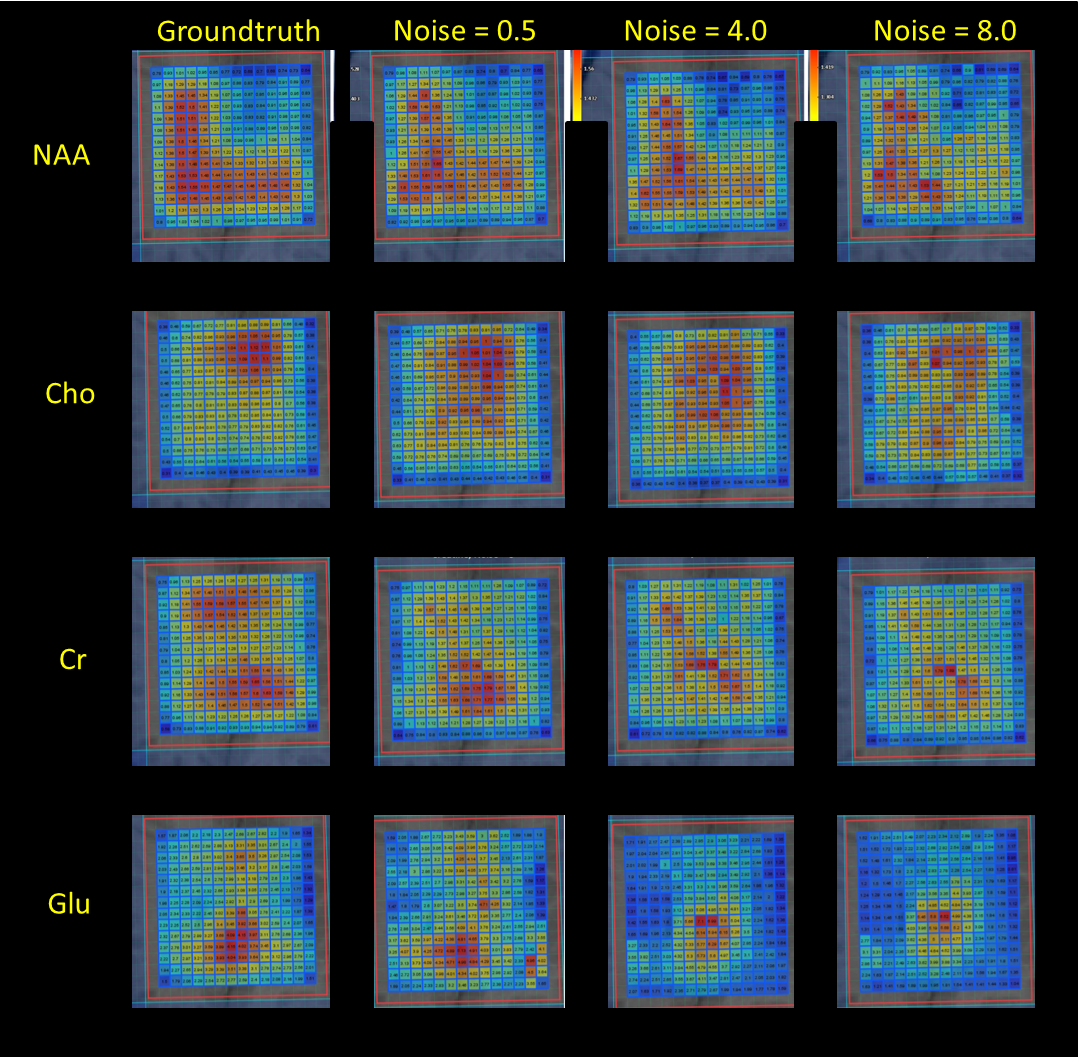
Figure 3: The first column displays the GT peak area maps as found by TDFDFit. The second column displays the RF-regressor predicted maps for the noise level 0.5 of the in vivo semiLASER data sets. The third and the fourth column show the predicted maps of noise level = 4 and noise level = 0.5. Example signals with very poor and extreme poor SNR are displayed in Figure 4.
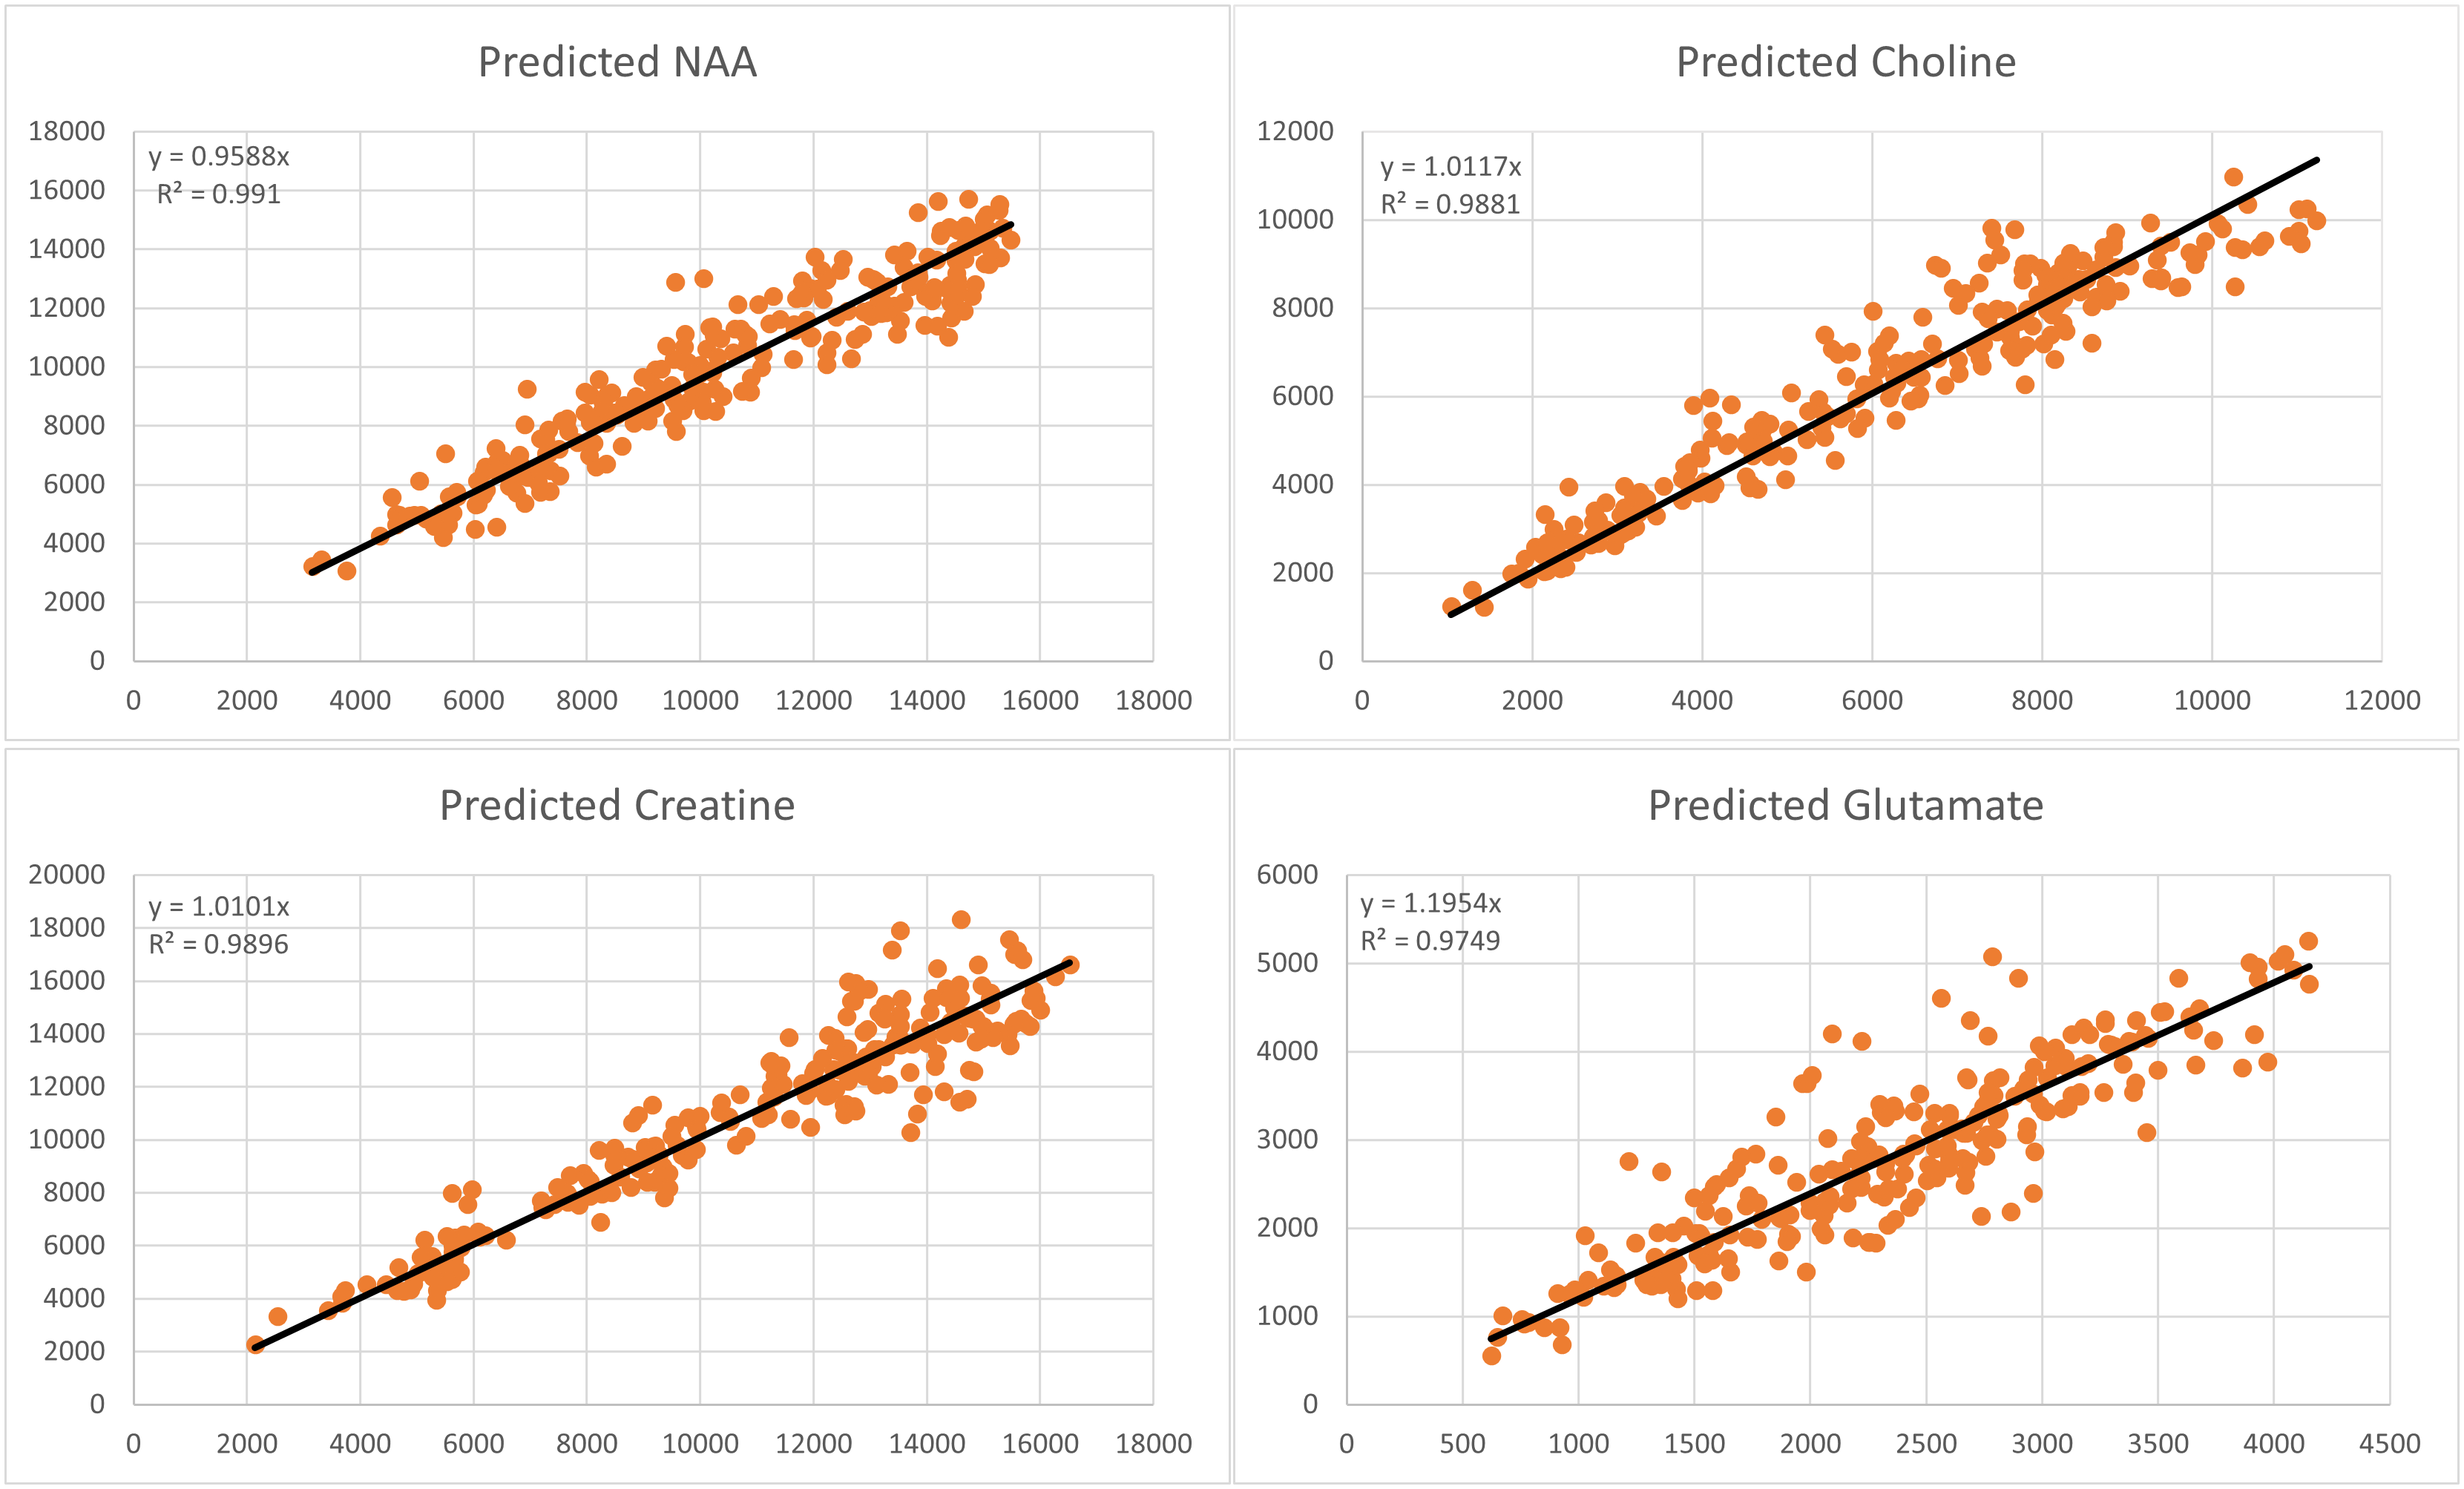
Figure 4: This figure shows the x-y-scatter plots for NAA, Cho, Cr, and Glu peak area parameters: horizontally the GT value obtained with TDFDFit, and vertically the RF-regressor predicted area parameter values. For NAA the coefficient of determination is best namely R2=0.991, for Cho -> R2=0.988 ,for Cr -> R2=0.989 and for Glu the worst namely R2=0.975. Note that the slope of all linear regression lines is between 0.96 for NAA and maximum 1.26 for Glu, in accordance with Cramér-Rao minimum variance bounds.