Ana Gogishvili1,2, Christopher E. J. Doppler3,4, Ezequiel Farrher1, Aline Seger3,4, Michael Sommerauer3,4, Ketevan Kotetishvili2, and N. Jon Shah1,5,6,7
1Institute of Neuroscience and Medicine 4, Medical Imaging Physics, Forschungszentrum Jülich, Jülich, Germany, 2Engineering Physics Department, Georgian Technical University, Tbilisi, Georgia, 3Institute of Neuroscience and Medicine 3, Forschungszentrum Jülich, Jülich, Germany, 4University of Cologne, Faculty of Medicine and University Hospital Cologne, Department of Neurology, Cologne, Germany, 5Institute of Neuroscience and Medicine 11, Forschungszentrum Jülich, Jülich, Germany, 6JARA BRAIN Translational Medicine, RWTH Aachen University, Aachen, Germany, 7Department of Neurology, Faculty of Medicine, RWTH Aachen University, Aachen, Germany
1Institute of Neuroscience and Medicine 4, Medical Imaging Physics, Forschungszentrum Jülich, Jülich, Germany, 2Engineering Physics Department, Georgian Technical University, Tbilisi, Georgia, 3Institute of Neuroscience and Medicine 3, Forschungszentrum Jülich, Jülich, Germany, 4University of Cologne, Faculty of Medicine and University Hospital Cologne, Department of Neurology, Cologne, Germany, 5Institute of Neuroscience and Medicine 11, Forschungszentrum Jülich, Jülich, Germany, 6JARA BRAIN Translational Medicine, RWTH Aachen University, Aachen, Germany, 7Department of Neurology, Faculty of Medicine, RWTH Aachen University, Aachen, Germany
We quantified the neurochemical profile of the human striatum in vivo in healthy control subjects acquired with a single voxel STEAM MRS sequence at 3T and 7T. To this end, we quantified the tissue differences for 12 reliably detected metabolites.
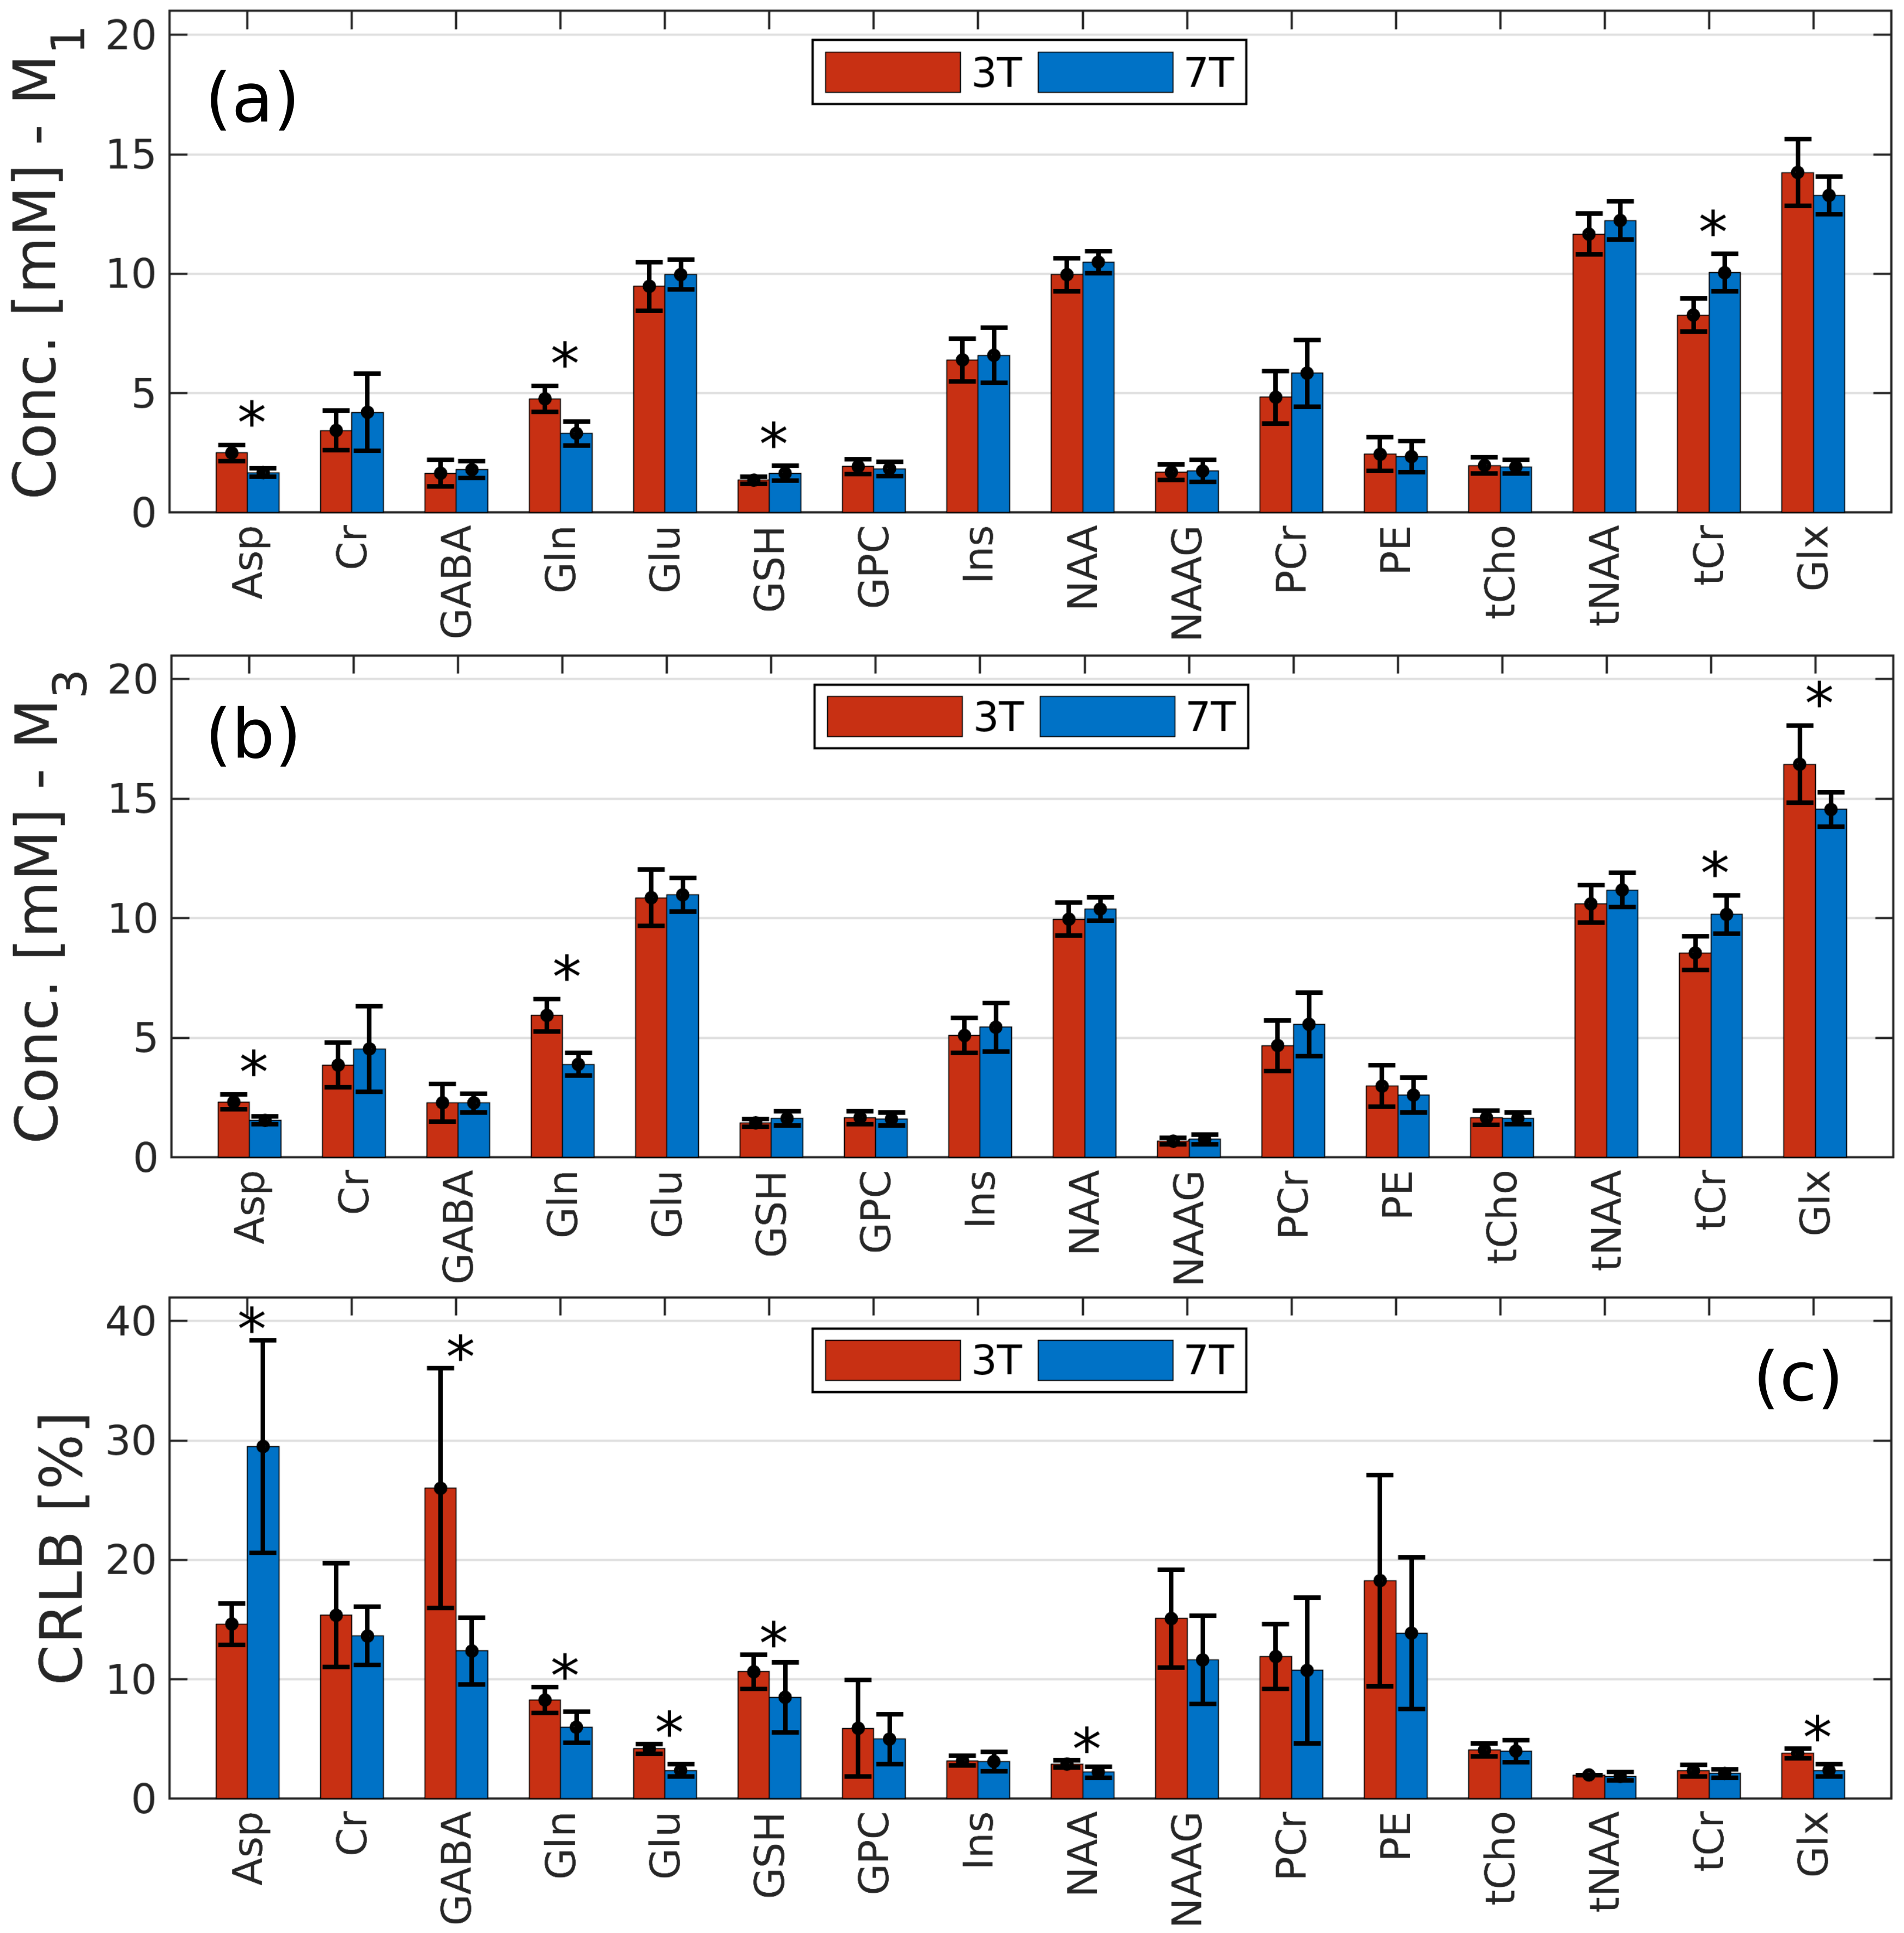
Figure 4. The mean metabolite concentrations across the whole group of subjects, for methods M1 (a), M3 (b), and the CRLB values (c). Total concentrations tCho=GPC+PCh, tNAA=NAA+NAAG, tCr=Cr+PCr and Glx=Glu+Gln are additionally shown.
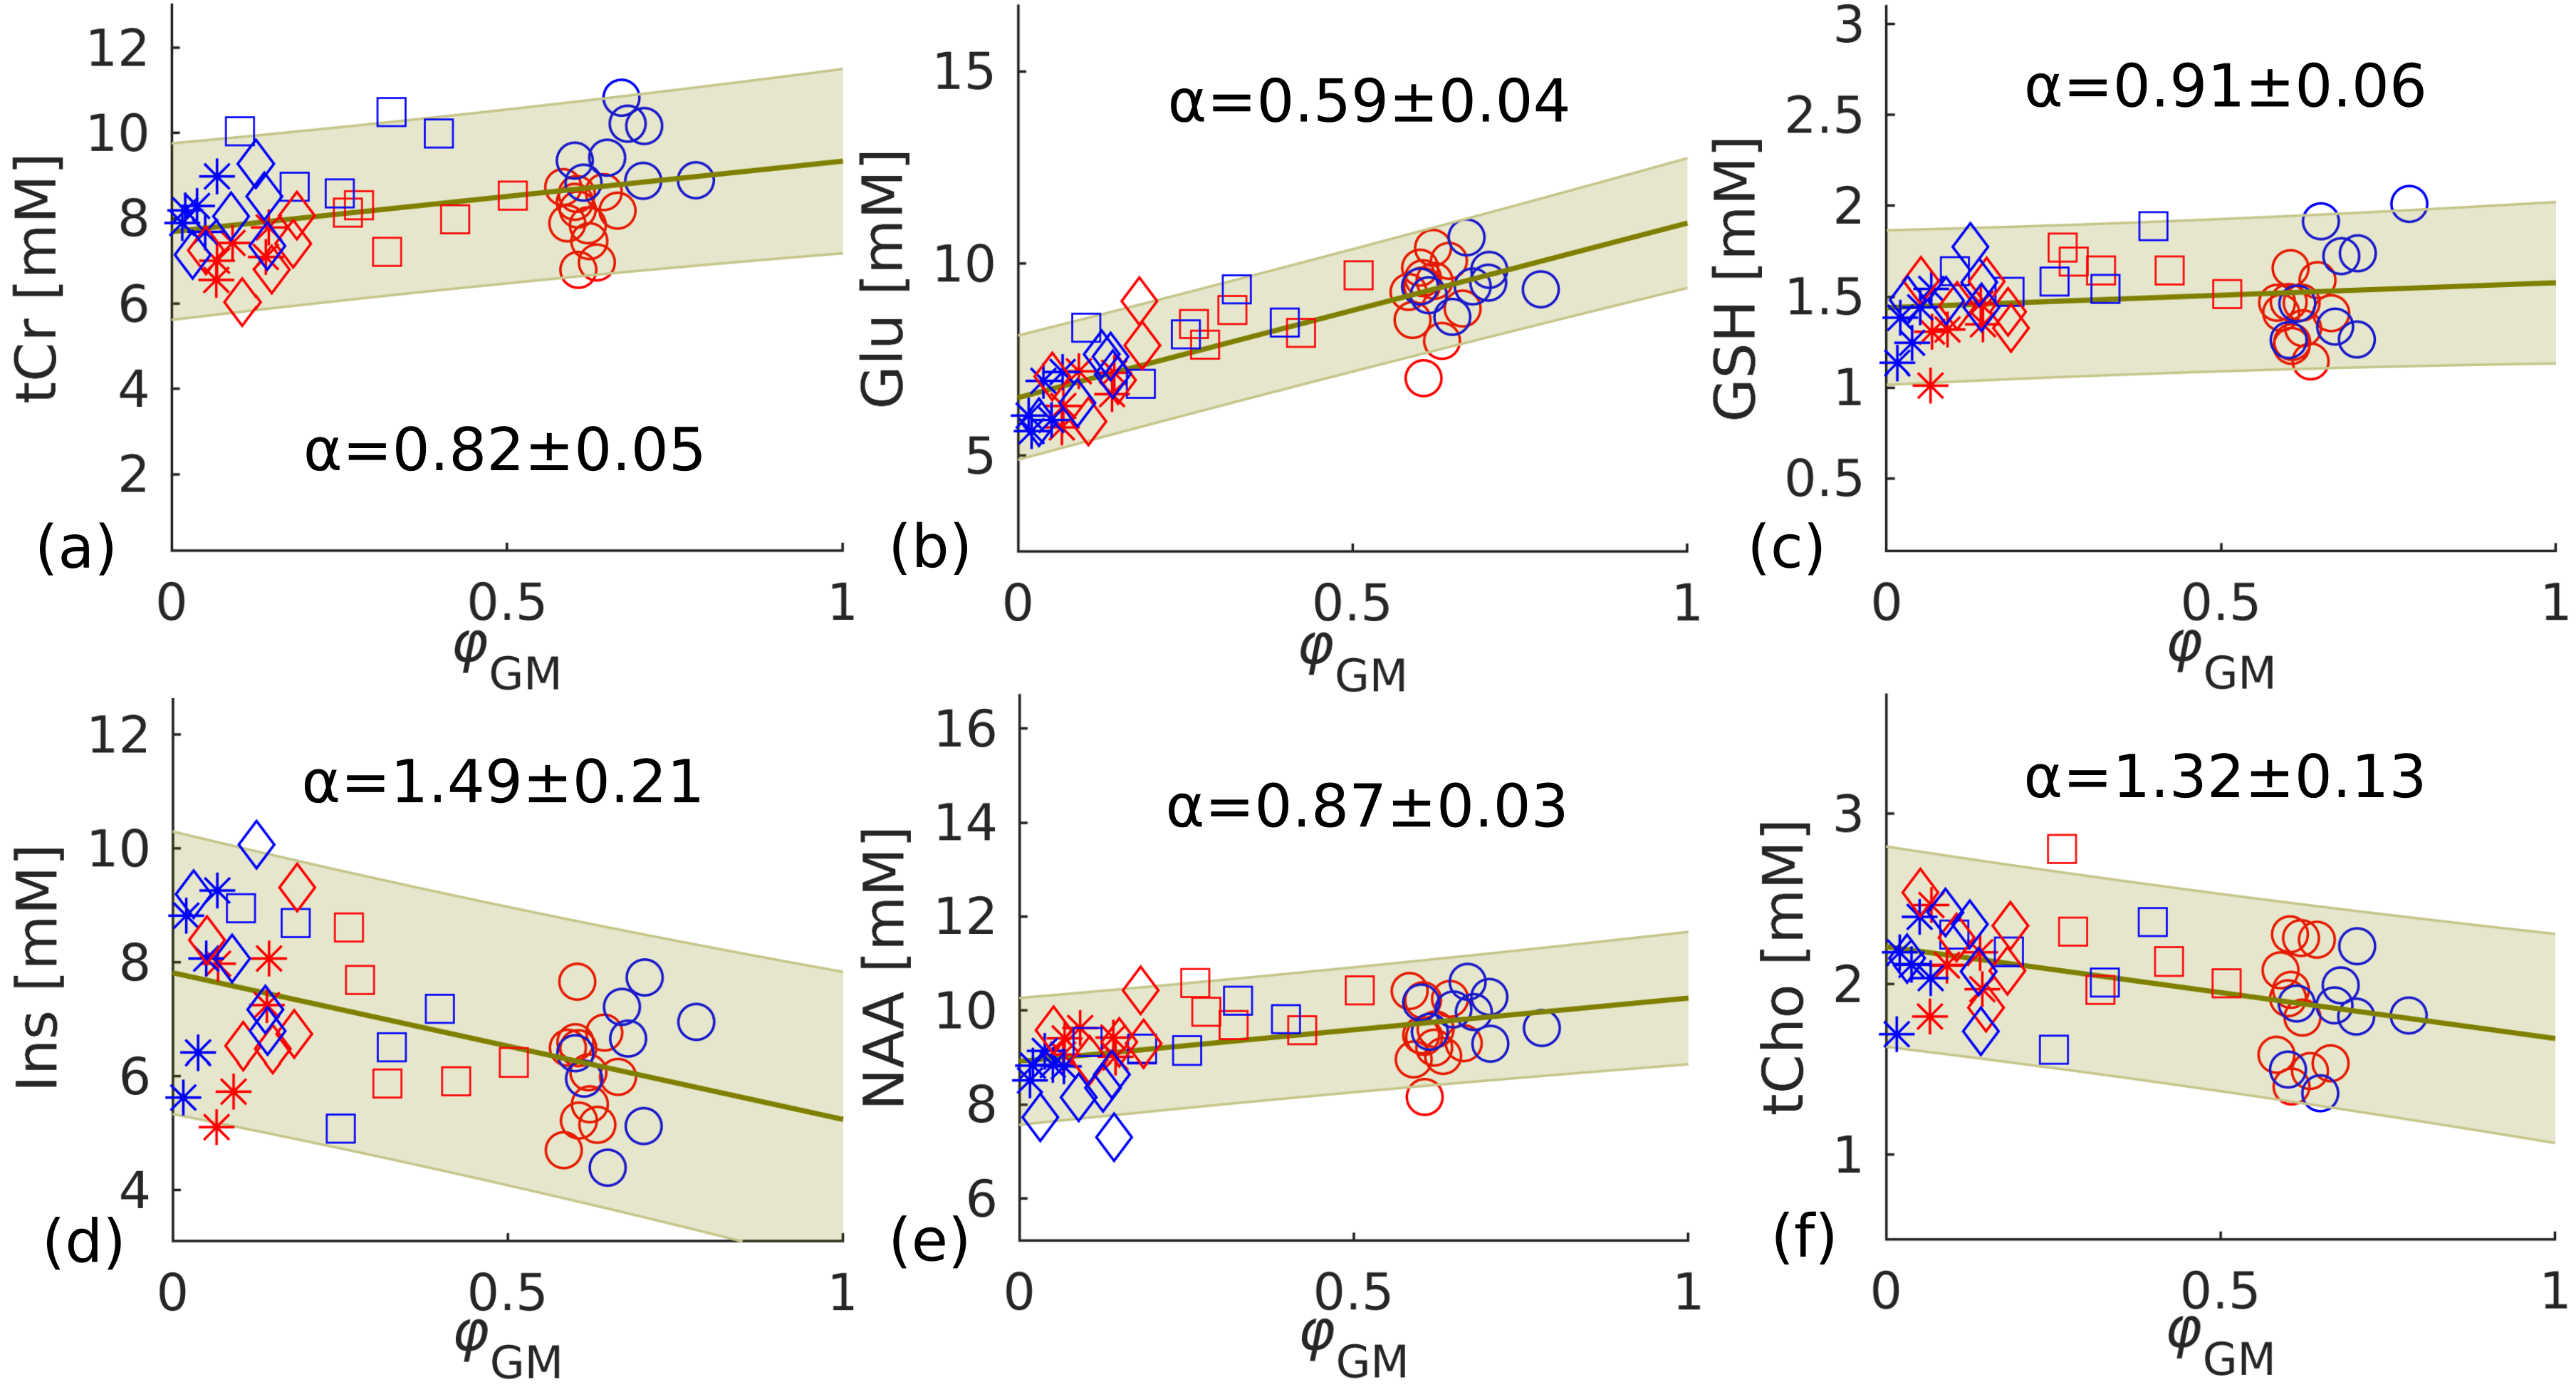
Figure 3. Linear regression (green line) estimated for tCr (a), Glu (b), GSH (c), Ins (d), NAA (e), tCho (f) using pooled 3T and 7T data. Metabolite concentrations of individual subjects determined from pooled results (3T and 7T) and the calculated α value for each metabolite. Different shapes represent different brain areas (o: striatum; ⧠: frontal WM; ◊: parietal WM; *: occipital WM). Blue and red points represent data from 7T and 3T, respectively. The green shaded area highlights the 95% confidence band.