Tonima Sumya Ali1 and Fernando Calamante1,2
1School of Biomedical Engineering, The University of Sydney, Sydney, Australia, 2Sydney Imaging, The University of Sydney, Sydney, Australia
1School of Biomedical Engineering, The University of Sydney, Sydney, Australia, 2Sydney Imaging, The University of Sydney, Sydney, Australia
We studied the
spatial distribution of 3 cortical (T1w/T2w, FA, AFDtotal) and 2 white
matter (FA, FOD) metrics in cortex and adjacent white matter. Merics show significant inter-correlation with distinctive spatial patterns suggesting complementary information on
cortical organisation.
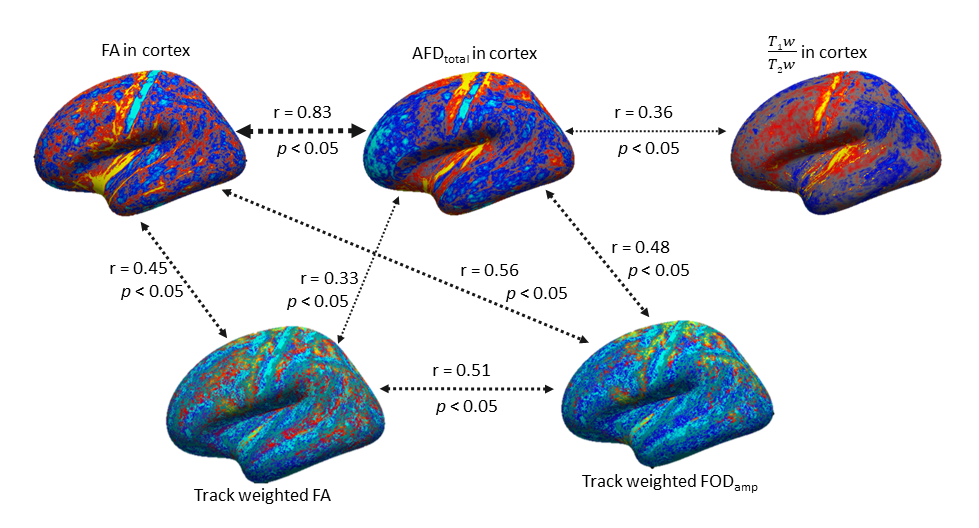
Pearson correlation coefficient
(r) obtained by pair-wise tests between parameters measured from cortical
region and tract-weighted maps for 10 subjects (N =
10). Correlation coefficient was statistically significant in each test
reported above (p < 0.05). The statistical tests were performed
on the data projected on the mid-cortical surface (so that each data set has
the same number of data points) to assess the relative correspondence of each
parameter on others. Only the correlation coefficients > 0.3 are reported.
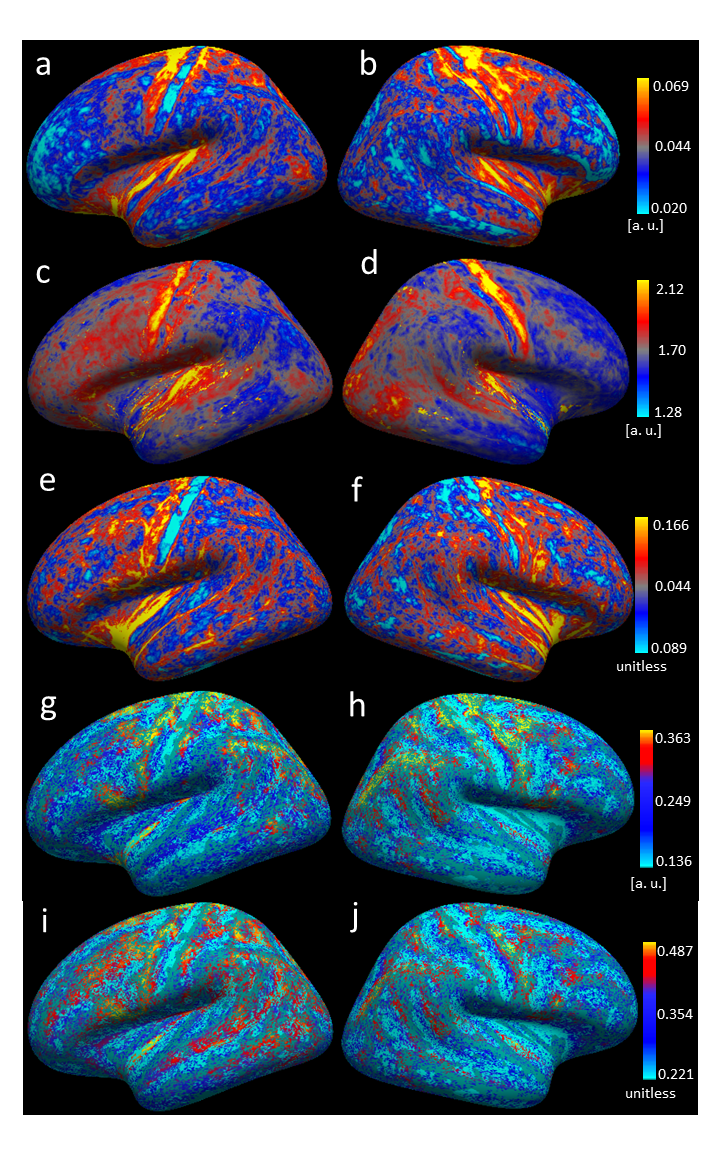
Group average (N =
10) representation of AFDtotal (a, b),
T1w/T2w (c, d), FA
(e, f),
track-weighted FODamplitude (g, h) and
track-weighted FA (i, j) maps
displayed on inflated surfaces for the left hemisphere (column 1) and right
hemisphere (column 2). The volumetric data (a - f) were averaged over 70% of
the cortical thickness and projected at the mid-cortical surface. The track-weighted data (g-j),
computed with fwhm
tract length of 40 mm, were sampled at the GM-WM boundary and were projected at
the mid-cortical surface.