1Department of Rehabilitation Science, Hokkaido University, Sapporo, Japan, 2Department of Biomarker Imaging Science, Hokkaido University, Sapporo, Japan, 3Department of Medical Physics, Hokkaido University Hospital, Sapporo, Japan, 4Department of Rehabilitation, Hokkaido University Hospital, Sapporo, Japan, 5Global Center for Biomedical Science and Engineering, Hokkaido University Faculty of Medicine, Sapporo, Japan
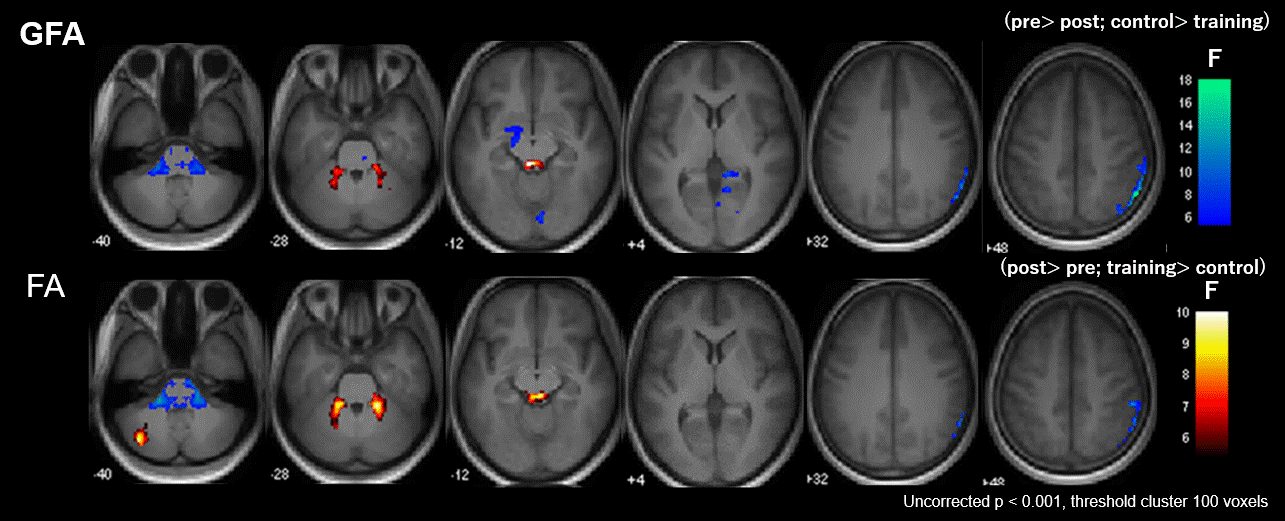
Figure 3. Significant group-by-time interaction observed in GFA and FA.
Clusters with significant interaction in the 2 × 2 mixed-design ANOVA (uncorrected P< 0.001, cluster threshold= 100 voxels) of GFA (upper low) and FA (lower row). The clusters are overlaid on the MPRAGE images. The look-up table indicates F-values for group × time interaction. Cool color indicates post-training assessment < pre-training assessment, training < control, and hot color indicates pre-training assessment < post-training assessment, control< training.
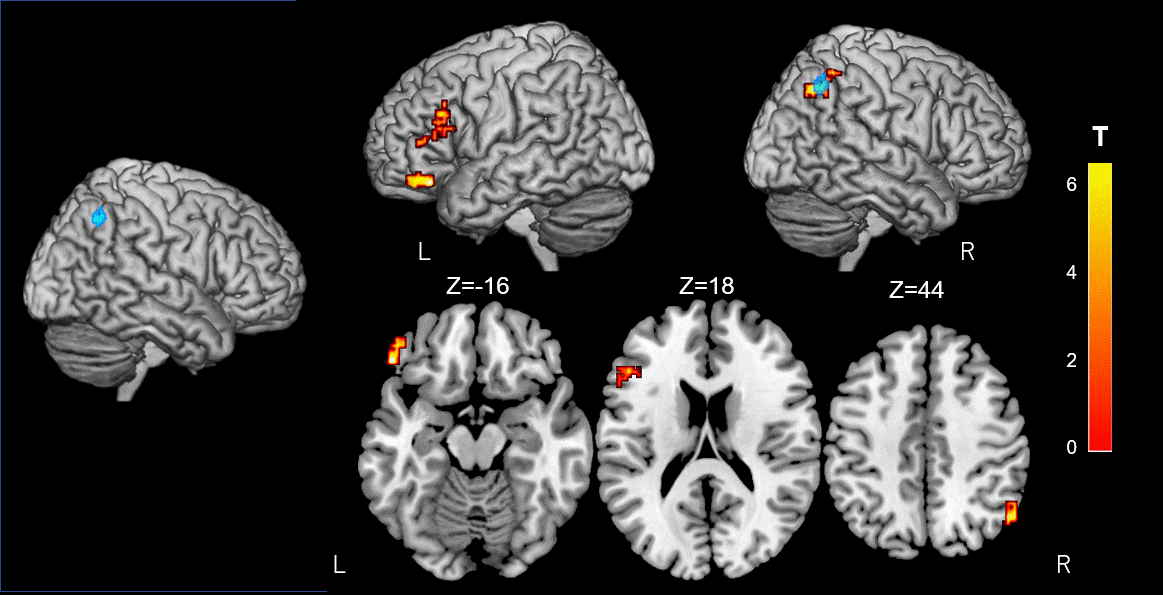
Figure 4. Alterations of resting-state functional connectivity in significant GFA Clusters.
The brain voxels which are functionally connected to the right inferior parietal lobule cluster (Blue) reveal a significant interaction in GFA using a 2 × 2 mixed-design ANOVA. The rsFC between this region and the left frontal pole, the inferior frontal gyrus and the right lateral occipital cortex, increases upon cognitive training (FWE-corrected P< 0.05). Significant clusters are shown on ch2better.nii template using MRIcron. The look-up table indicates the T-value.