Stefanie A. Tremblay1,2, Anna-Thekla Jäger3, Julia Huck1, Chiara Giacosa1, Stephanie Beram1, Uta Schneider3, Sophia Grahl3, Arno Villringer3,4,5,6, Christine Lucas Tardif7,8, Pierre-Louis Bazin3,9, Christopher J Steele3,10, and Claudine J. Gauthier1,2
1Physics, Concordia University, Montreal, QC, Canada, 2Montreal Heart Institute, Montreal, QC, Canada, 3Neurology, Max Planck Institute for Human Cognitive and Brain Sciences, Leipzig, Germany, 4Clinic for Cognitive Neurology, Leipzig, Germany, 5Leipzig University Medical Centre, IFB Adiposity Diseases, Leipzig, Germany, 6Collaborative Research Centre 1052-A5, University of Leipzig, Leipzig, Germany, 7Biomedical Engineering, McGill University, Montreal, QC, Canada, 8Montreal Neurological Institute, Montreal, QC, Canada, 9Faculty of Social and Behavioral Sciences, University of Amsterdam, Amsterdam, Netherlands, 10Psychology, Concordia University, Montreal, QC, Canada
1Physics, Concordia University, Montreal, QC, Canada, 2Montreal Heart Institute, Montreal, QC, Canada, 3Neurology, Max Planck Institute for Human Cognitive and Brain Sciences, Leipzig, Germany, 4Clinic for Cognitive Neurology, Leipzig, Germany, 5Leipzig University Medical Centre, IFB Adiposity Diseases, Leipzig, Germany, 6Collaborative Research Centre 1052-A5, University of Leipzig, Leipzig, Germany, 7Biomedical Engineering, McGill University, Montreal, QC, Canada, 8Montreal Neurological Institute, Montreal, QC, Canada, 9Faculty of Social and Behavioral Sciences, University of Amsterdam, Amsterdam, Netherlands, 10Psychology, Concordia University, Montreal, QC, Canada
WM microstructure is altered in a stage-specific manner in the sensorimotor network in participants learning a complex motor sequence. Fast changes in WM tracts underlying the SMA, a region known for its role in sequence processing, as well as slower changes in S1 and M1, were observed.
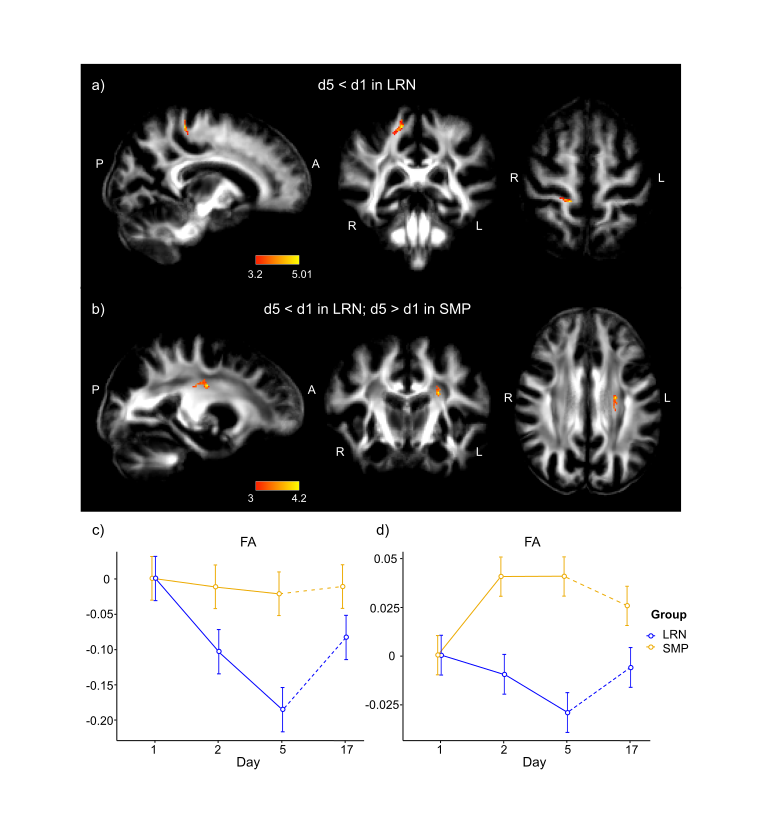
Figure 2. Changes in FA from voxel-wise analyses. a) Decrease in FA in the LRN group in WM tracts underlying S1 during overall learning (d1-d5). b) Decrease in FA in LRN and increase in SMP in WM tracts underlying M1 during overall learning (d1-d5). c-d) Mean changes in FA across time in both groups in the right S1 (c) and in the left M1 (d). Expressed as relative changes from baseline (d1). LRN: learning group (in blue); SMP: control group (in orange).
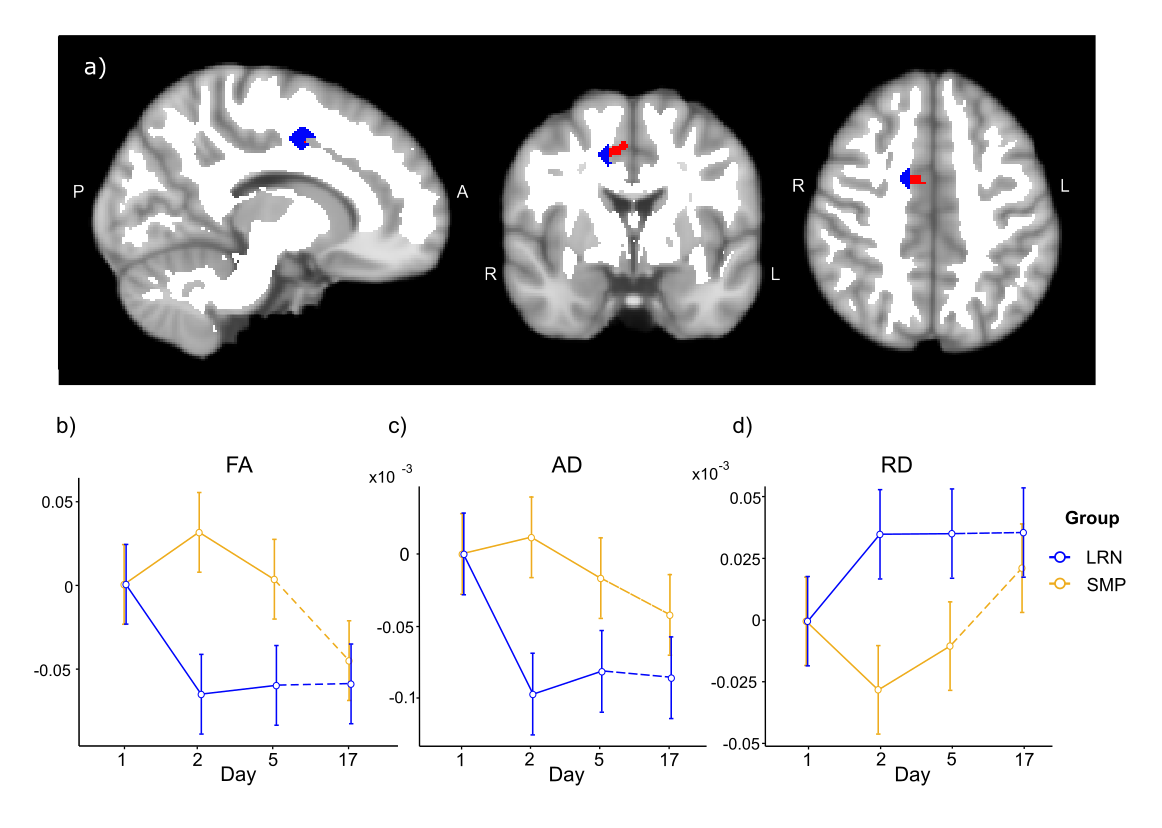
Figure 3. Changes in WM microstructure in the ROI underlying the right supplementary area (SMA) where changes in functional connectivity were found (unpublished). a) The right SMA ROI from resting-state analyses (in red) and the WM ROI (in blue; overlaid on the WM mask in white) are both overlaid on the MNI152 template. b-d) Mean changes in DTI metrics from baseline (d1) in both groups: FA (b) and AD (c) decreased in the LRN group between d1 and d2 and remained lower at d5 and d17. RD increased between d1 and d2 in LRN and remained higher at d5 and d17 (d).