Thijs Dhollander1, Claire Kelly1,2, Ian Harding3,4, Wasim Khan3, Richard Beare1, Jeanie Cheong2,5,6, Lex Doyle2,5,6,7, Marc Seal1,7, Deanne Thompson1,2,7, and Peter Anderson2,8
1Developmental Imaging, Murdoch Children's Research Institute, Melbourne, Australia, 2Victorian Infant Brain Studies (VIBeS), Murdoch Children's Research Institute, Melbourne, Australia, 3Department of Neuroscience, Central Clinical School, Monash University, Melbourne, Australia, 4Monash Biomedical Imaging, Monash University, Melbourne, Australia, 5Newborn Research, The Royal Women's Hospital, Melbourne, Australia, 6Department of Obstetrics and Gynaecology, The University of Melbourne, Melbourne, Australia, 7Department of Paediatrics, The University of Melbourne, Melbourne, Australia, 8Turner Institute for Brain and Mental Health and School of Psychological Sciences, Monash University, Melbourne, Australia
1Developmental Imaging, Murdoch Children's Research Institute, Melbourne, Australia, 2Victorian Infant Brain Studies (VIBeS), Murdoch Children's Research Institute, Melbourne, Australia, 3Department of Neuroscience, Central Clinical School, Monash University, Melbourne, Australia, 4Monash Biomedical Imaging, Monash University, Melbourne, Australia, 5Newborn Research, The Royal Women's Hospital, Melbourne, Australia, 6Department of Obstetrics and Gynaecology, The University of Melbourne, Melbourne, Australia, 7Department of Paediatrics, The University of Melbourne, Melbourne, Australia, 8Turner Institute for Brain and Mental Health and School of Psychological Sciences, Monash University, Melbourne, Australia
We demonstrate the application of 3-tissue compositional analysis to study cortical microstructure, and identified changes to the cortical microstructural tissue composition in preterm-born children at age 13 years compared to typically developing children.

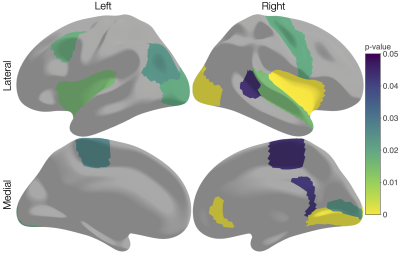
Figure 2. Cortical regions in which the overall 3-tissue composition differed significantly (p<0.05, FDR-corrected) between preterm-born and term-born children, when performing compositional data analysis via multivariate statistical analysis on the isometric log-ratio transformed 3-tissue compositions.

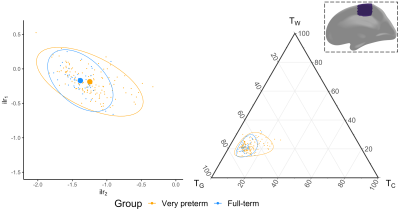
Figure 4. For a region in the sensorimotor (right paracentral) cortex, this shows: a scatter plot of the isometric log ratios (ilr), highlighting the overall group difference in tissue compositions (left); a ternary plot of the relative fractions of WM-like (TW), GM-like (TG), and CSF-like (TC) signal per participant, highlighting the relative shift from TG towards fluid-like (TC) composition (right). Ellipses are 95% confidence areas (the same area takes on a different shape in the ternary plot visually).
