Judith Zimmermann1,2, Michael Loecher1,3, Tyler Cork1,4, Kathrin Bäumler1, Alison Marsden5,6,7, Dominik Fleischmann1,7, and Daniel Ennis1,3,7
1Radiology, Stanford University, Stanford, CA, United States, 2Computer Science, Technical University of Munich, Munich, Germany, 3Radiology, Veterans Affairs Health Care System, Palo Alto, CA, United States, 4Bioengineering, Stanford University, Palo Alto, CA, United States, 5Pediatrics, Stanford University, Stanford, CA, United States, 6Bioengineering, Stanford University, Stanford, CA, United States, 7Cardiovascular Institute, Stanford University, Stanford, CA, United States
1Radiology, Stanford University, Stanford, CA, United States, 2Computer Science, Technical University of Munich, Munich, Germany, 3Radiology, Veterans Affairs Health Care System, Palo Alto, CA, United States, 4Bioengineering, Stanford University, Palo Alto, CA, United States, 5Pediatrics, Stanford University, Stanford, CA, United States, 6Bioengineering, Stanford University, Stanford, CA, United States, 7Cardiovascular Institute, Stanford University, Stanford, CA, United States
Multi-directional (ICOSA6) 4D-flow
encoding compares well to Cartesian 4D-flow if performed with adequate
sampling. Highly under-sampled (R>40) ICOSA6 4D-flow, however, impairs
qualitative flow visualization, underestimates net flow, results in inaccurate
peak flow measurements.
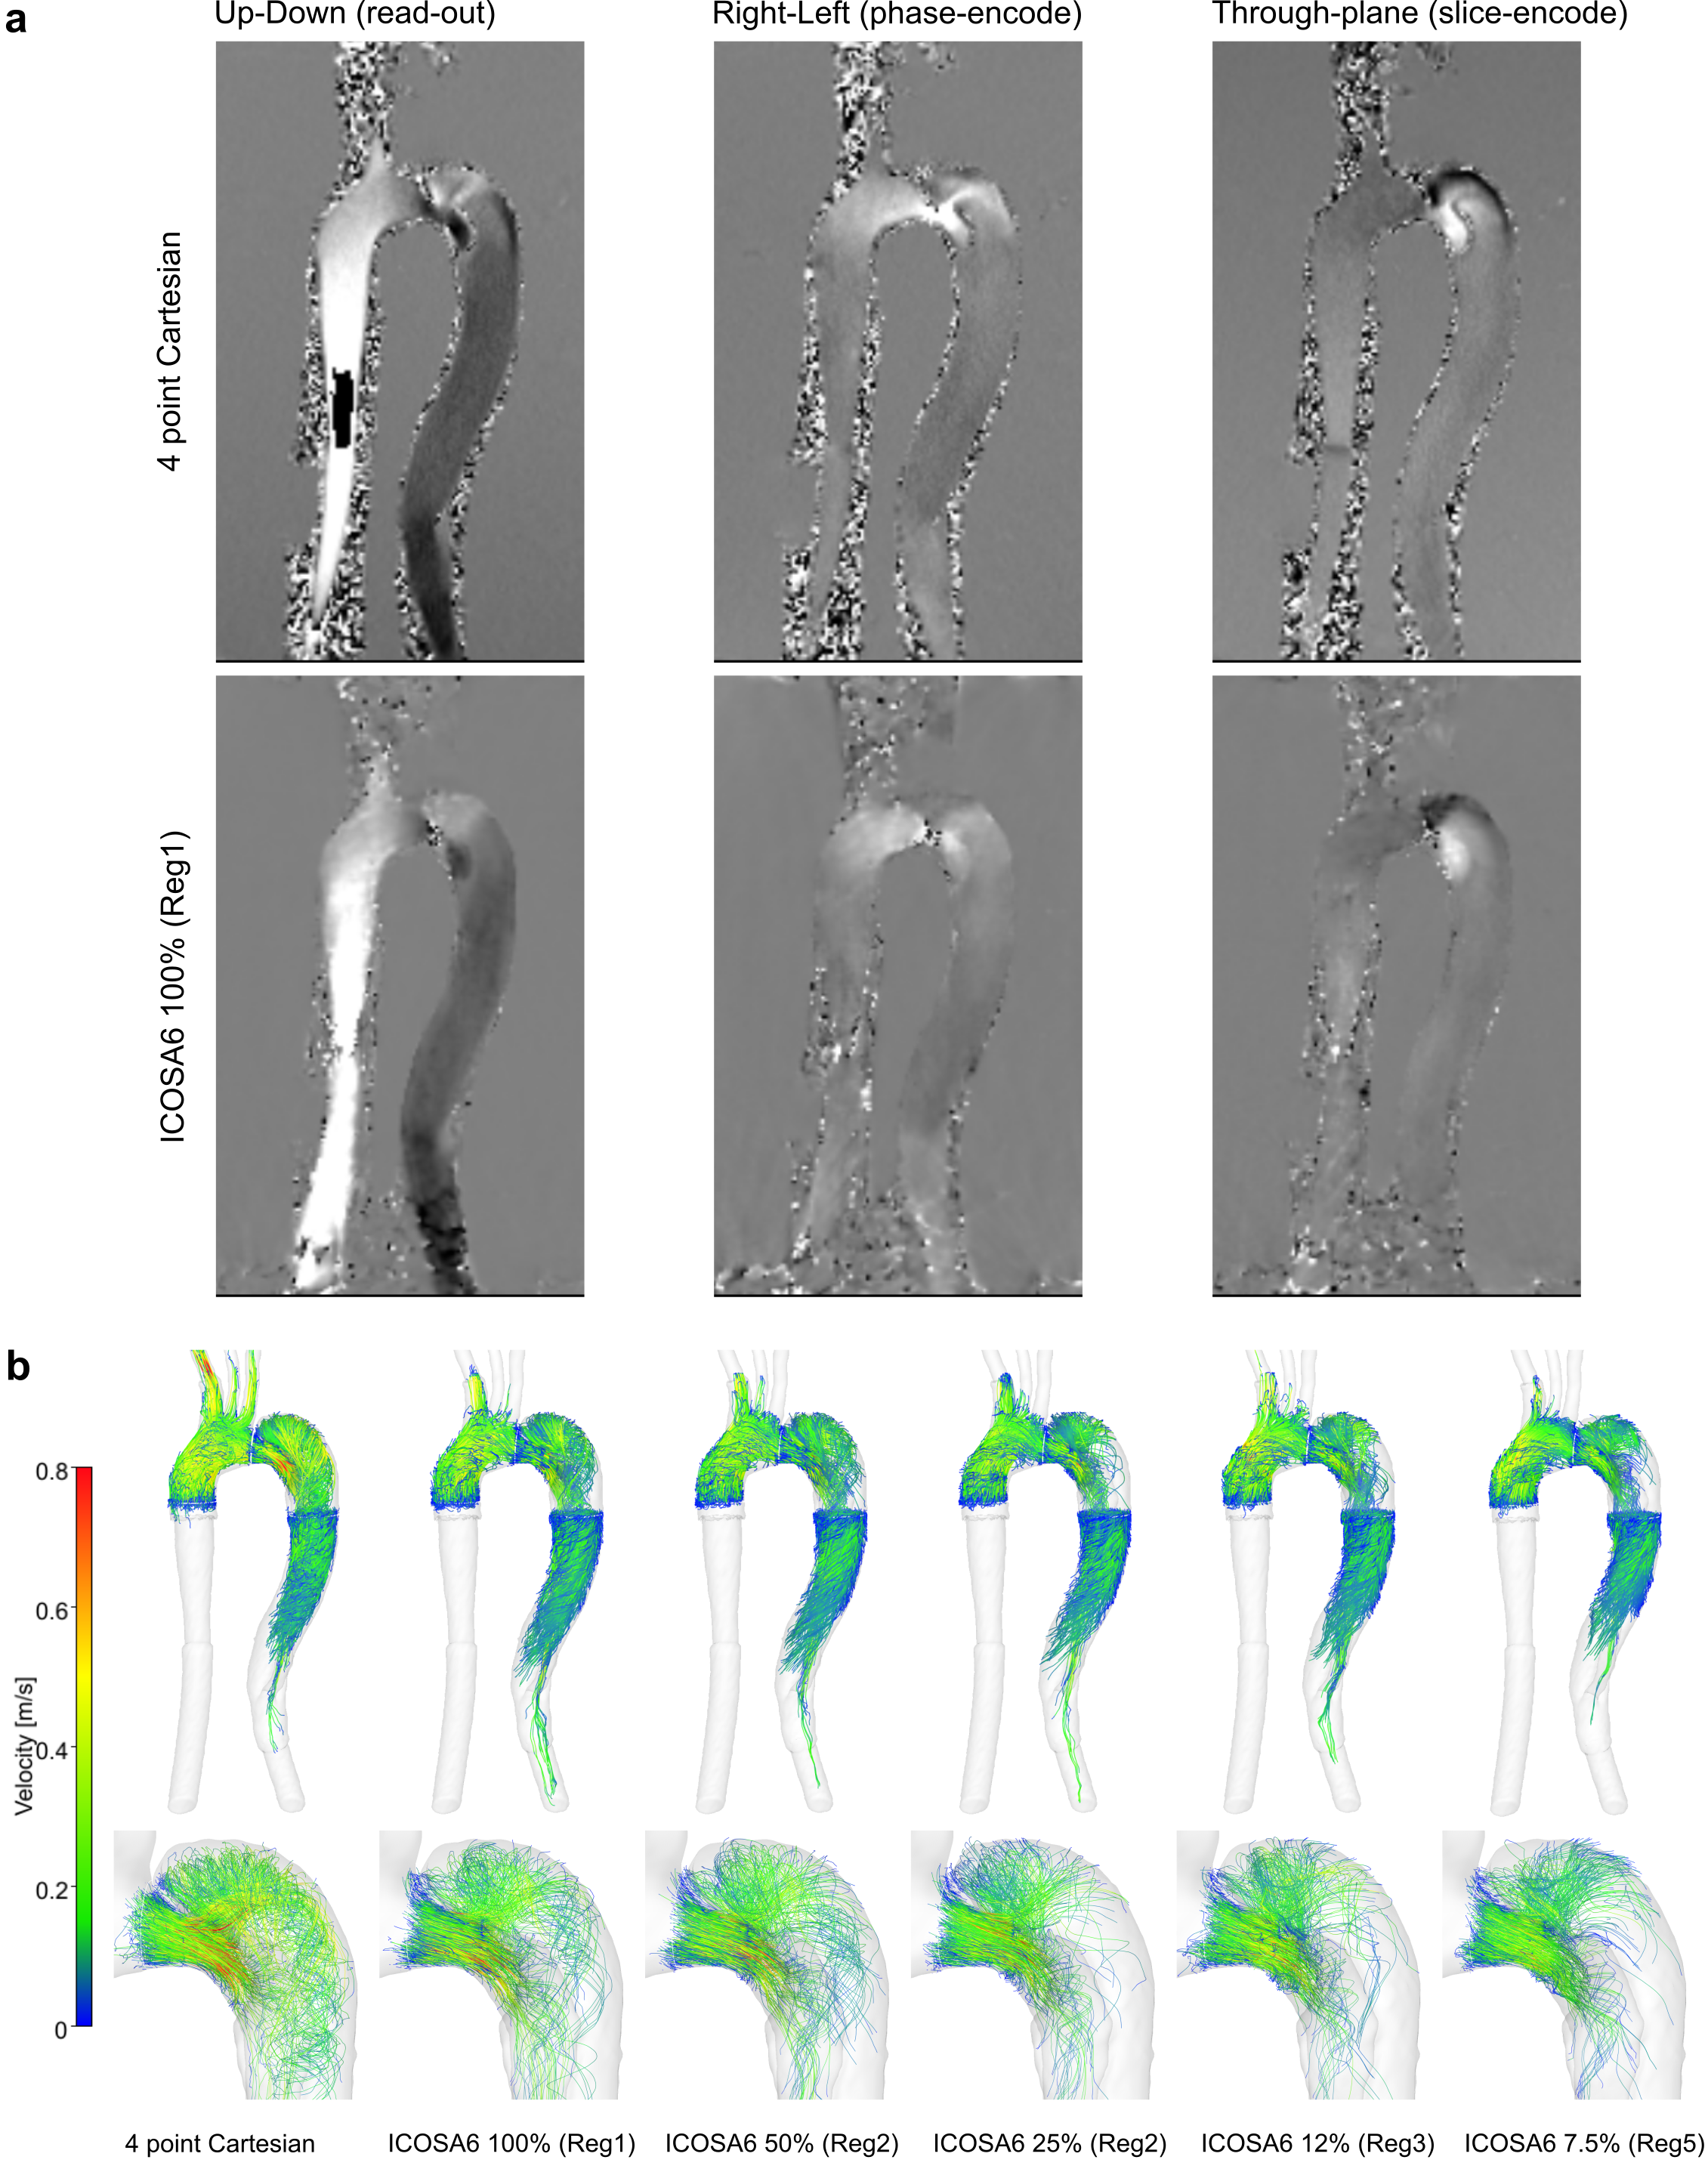
Fig. 2 (a) Phase data for four-point Cartesian and ICOSA6 100%. Smoothing effects
were observed in ICOSA6 data, particularly where
helical flow with a large velocity range is present. Four-point Cartesian included
aliased pixels prior to the model inlet, which was not present in ICOSA6 data. (b) End-diastolic pathlines based on four-point
Cartesian and ICOSA6 data. With increased under-sampling, the pathline travelling
range decreased, the detection of helical flow in the proximal FL becomes more
challenging, and jet flow velocities (entry tear) become smaller.
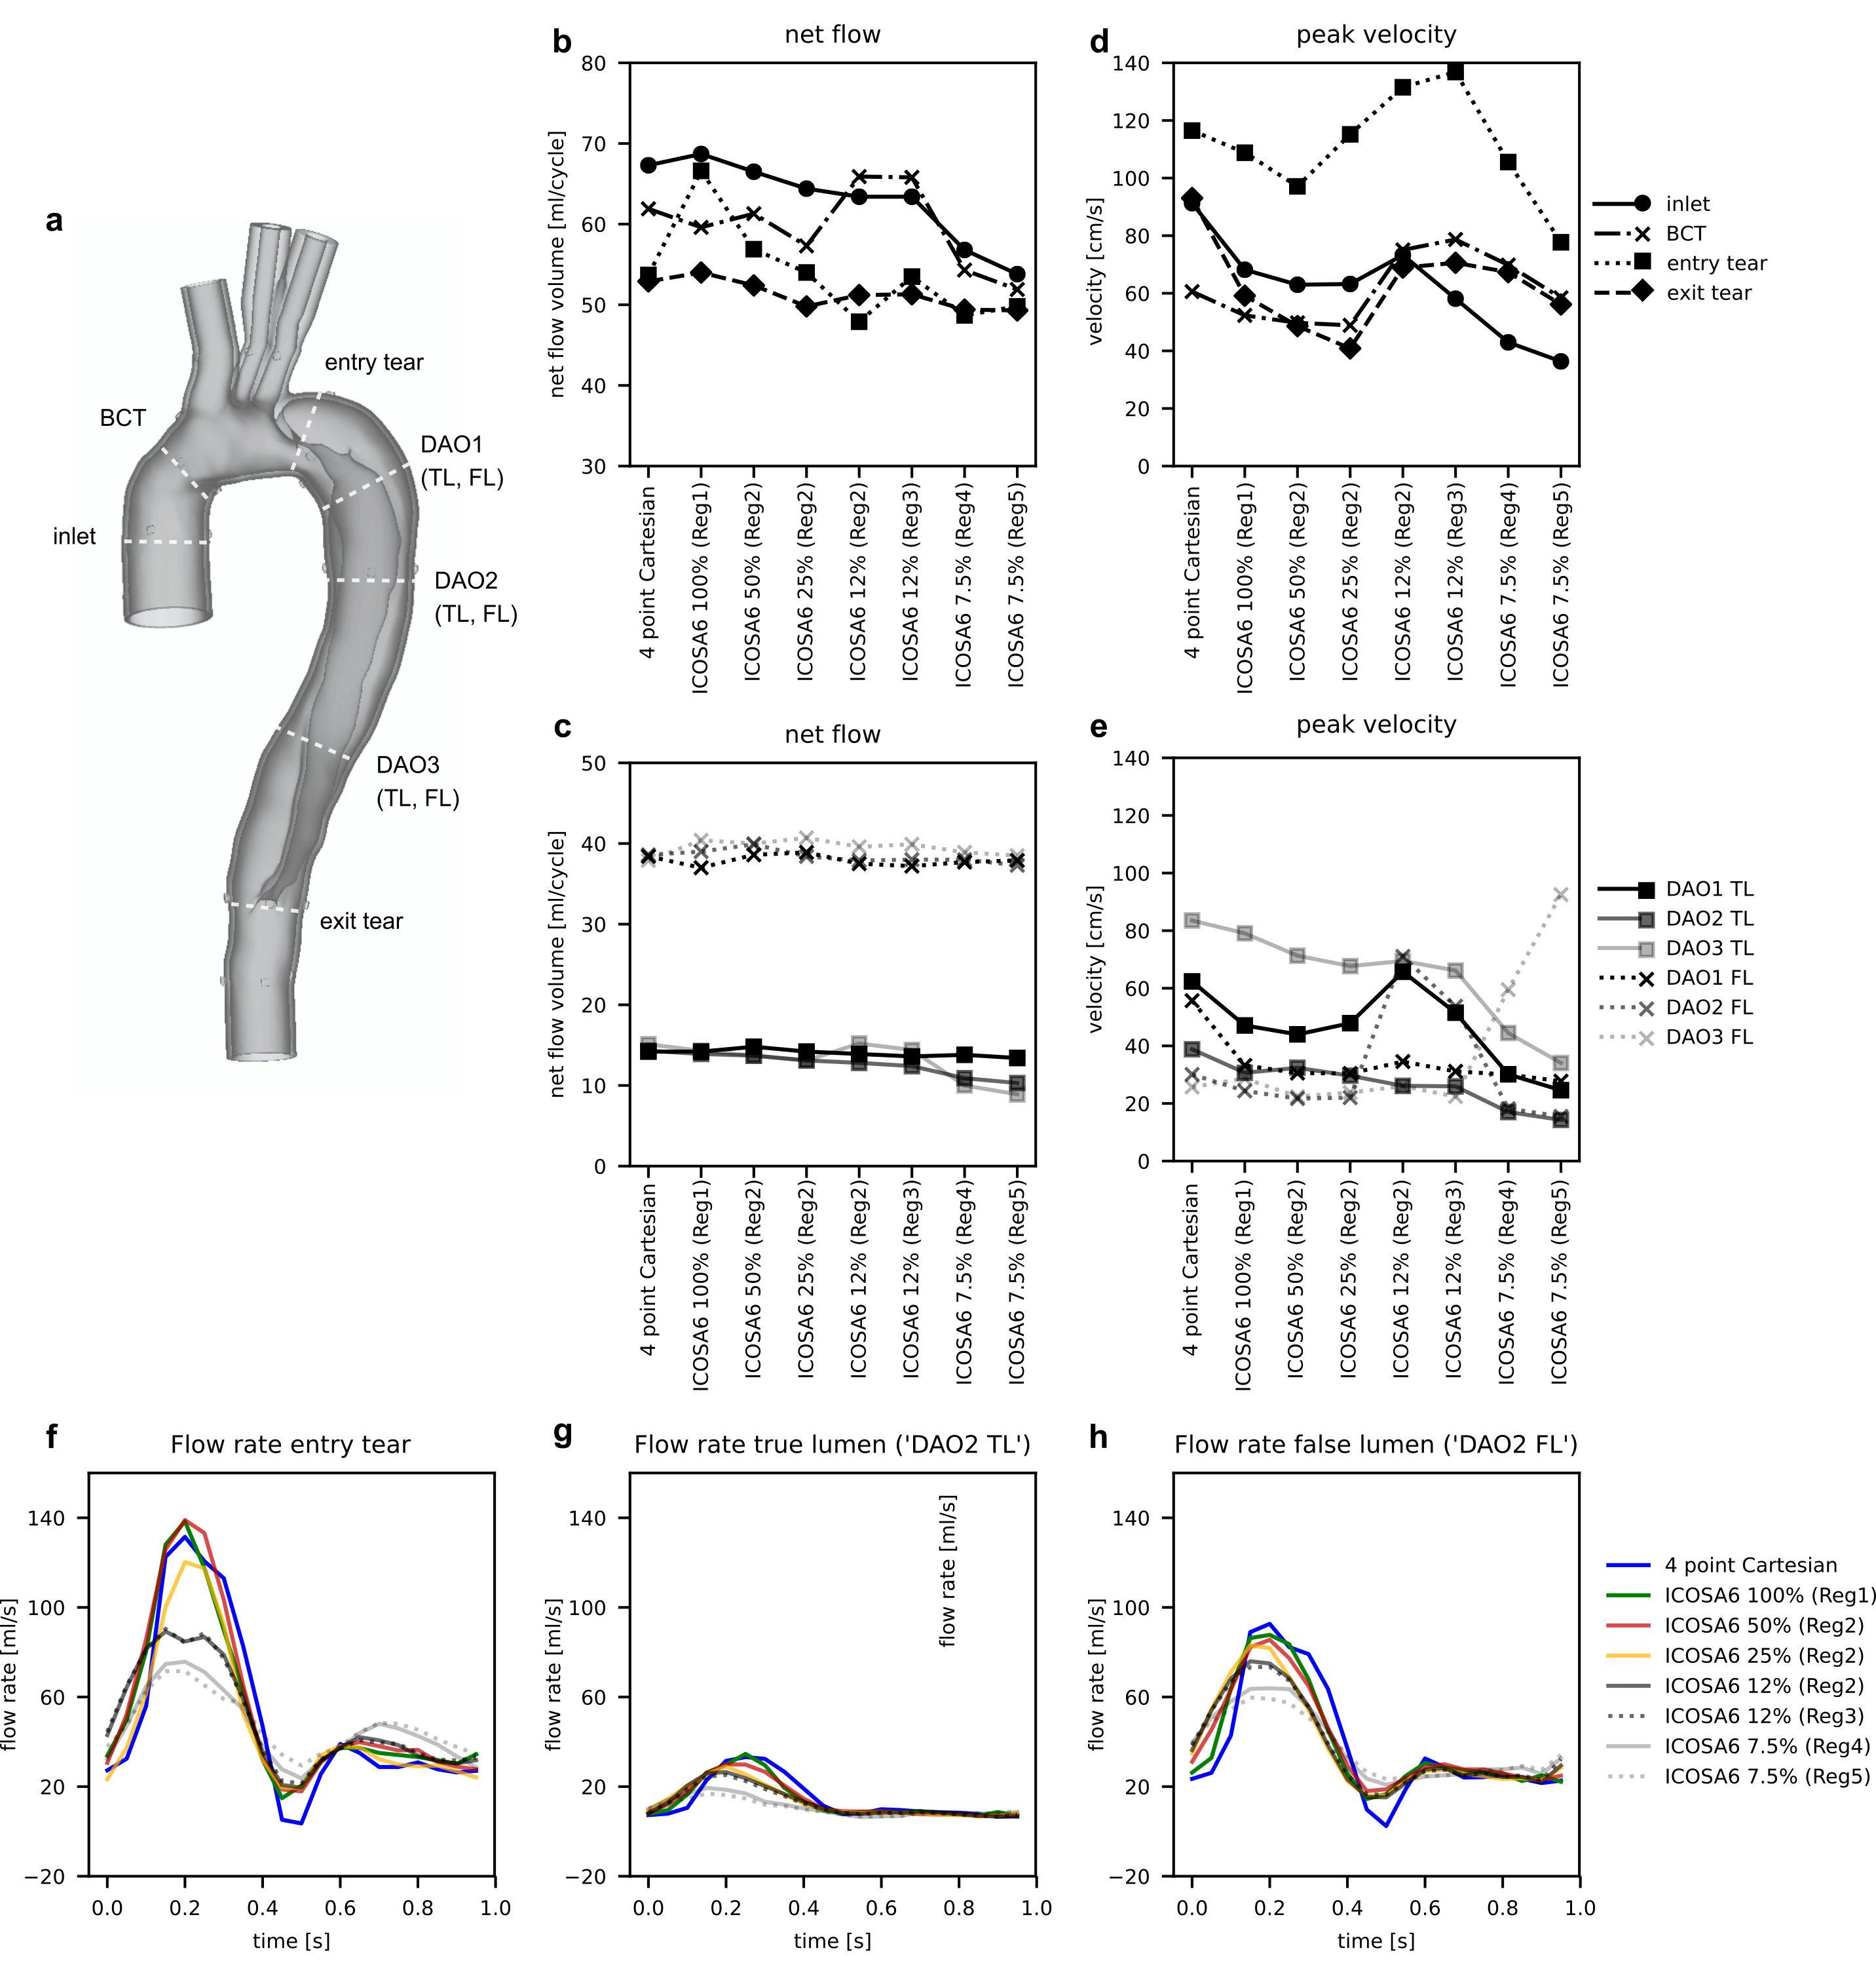
Fig. 3 (a) TBAD cross-sections. (b, c) Calculated net flow and (d, e) peak velocity for four-point Cartesian
and ICSOA6. Conservation of mass dictates that net flow through ‘inlet’ versus
‘BCT, ‘entry tear’ versus ‘exit tear’, all TL sections, as well as all FL
sections should be equal. Flow waveforms shown for the entry tear (f), true lumen (g), and false lumen (h).
Overall, flow waveforms between the four-point Cartesian (blue) and ICOSA6 100%
(green) as well as 50% (red) correspond well. With increased under-sampling of
ICOSA6 reconstructions, peak flow rates decrease by up to 49.1%.