Hideaki Kutsuna1, Hideki Ota2,3, Yoshimori Kassai4, Hidenori Takeshima5, Tatsuo Nagasaka6, Takashi Nishina7, Yoshiaki Morita3, and Kei Takase3,8
1MRI Systems Development Department, Canon Medical Systems Corporation, Kanagawa, Japan, 2Department of Advanced MRI Collaboration Research, Tohoku University Graduate School of Medicine, Miyagi, Japan, 3Department of Diagnostic Radiology, Tohoku University Hospital, Miyagi, Japan, 4CT-MR Solution Planning Department, Canon Medical Systems Corporation, Tochigi, Japan, 5Advanced Technology Research Department, Research and Development Center, Canon Medical Systems Corporation, Kanagawa, Japan, 6Department of Radiological Technology, Tohoku University Hospital, Miyagi, Japan, 7MRI Sales Department, Canon Medical Systems Corporation, Miyagi, Japan, 8Department of Diagnostic Radiology, Tohoku University Graduate School of Medicine, Miyagi, Japan
1MRI Systems Development Department, Canon Medical Systems Corporation, Kanagawa, Japan, 2Department of Advanced MRI Collaboration Research, Tohoku University Graduate School of Medicine, Miyagi, Japan, 3Department of Diagnostic Radiology, Tohoku University Hospital, Miyagi, Japan, 4CT-MR Solution Planning Department, Canon Medical Systems Corporation, Tochigi, Japan, 5Advanced Technology Research Department, Research and Development Center, Canon Medical Systems Corporation, Kanagawa, Japan, 6Department of Radiological Technology, Tohoku University Hospital, Miyagi, Japan, 7MRI Sales Department, Canon Medical Systems Corporation, Miyagi, Japan, 8Department of Diagnostic Radiology, Tohoku University Graduate School of Medicine, Miyagi, Japan
This presentation shows a new result for acquiring improved
time intensity curves of dynamic contrast enhanced MRI. A method based on
convolutional neural network was shown as a better method than a method based
on compressed sensing.
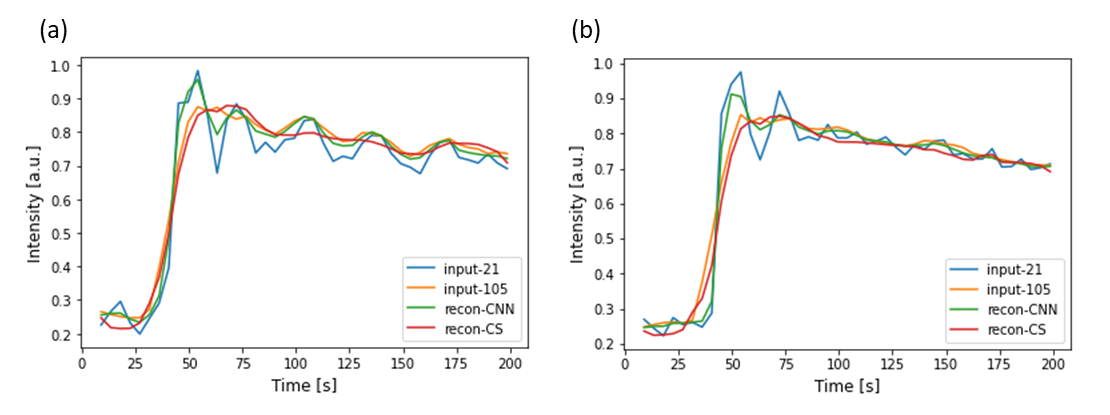
Time intensity curves obtained from the two volunteers.
(a) TIC from the first volunteer.
(b) TIC from the second volunteer.
Blue, Yellow, Green, Red lines represent TICs from input-21, input-105, recon-CNN and recon-CS, respectively.
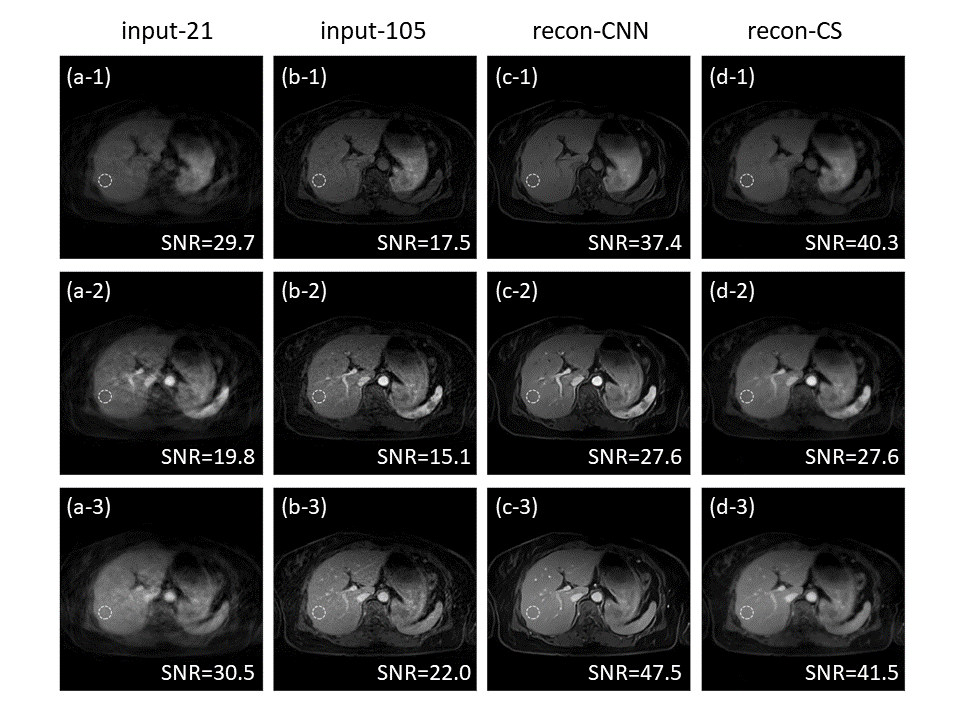
Reconstructed images from the first test volunteer.
(a) A subset of the input images with 21 spoke per frame (input-21.)
(b) A subset of the input images with 105 spoke per frame (input-105.)
(c) Output images from the CNN (recon-CNN.)
(d) Reconstructed images with the CS algorithm (recon-CS.)
Rows of the image matrix represent different temporal frame.
Dashed circles indicate the regions that the SNRs are calculated.