Tobit Führes1, Andreas Julian Riexinger1, Jan Martin2, Martin Gerhard Loh1, Bernhard Hensel3, Michael Uder1, and Frederik Bernd Laun1
1University Hospital Erlangen, Erlangen, Germany, 2Lund University, Lund, Sweden, 3Friedrich-Alexander-Universität Erlangen-Nürnberg, Erlangen, Germany
1University Hospital Erlangen, Erlangen, Germany, 2Lund University, Lund, Sweden, 3Friedrich-Alexander-Universität Erlangen-Nürnberg, Erlangen, Germany
Unlike for the perfusion fractions, a TE-dependence of the bi- and triexponential pseudodiffusion coefficients was not observed in measurements of healthy liver parenchyma indicating that they can be compared without TE-correction among studies performed with different TE.
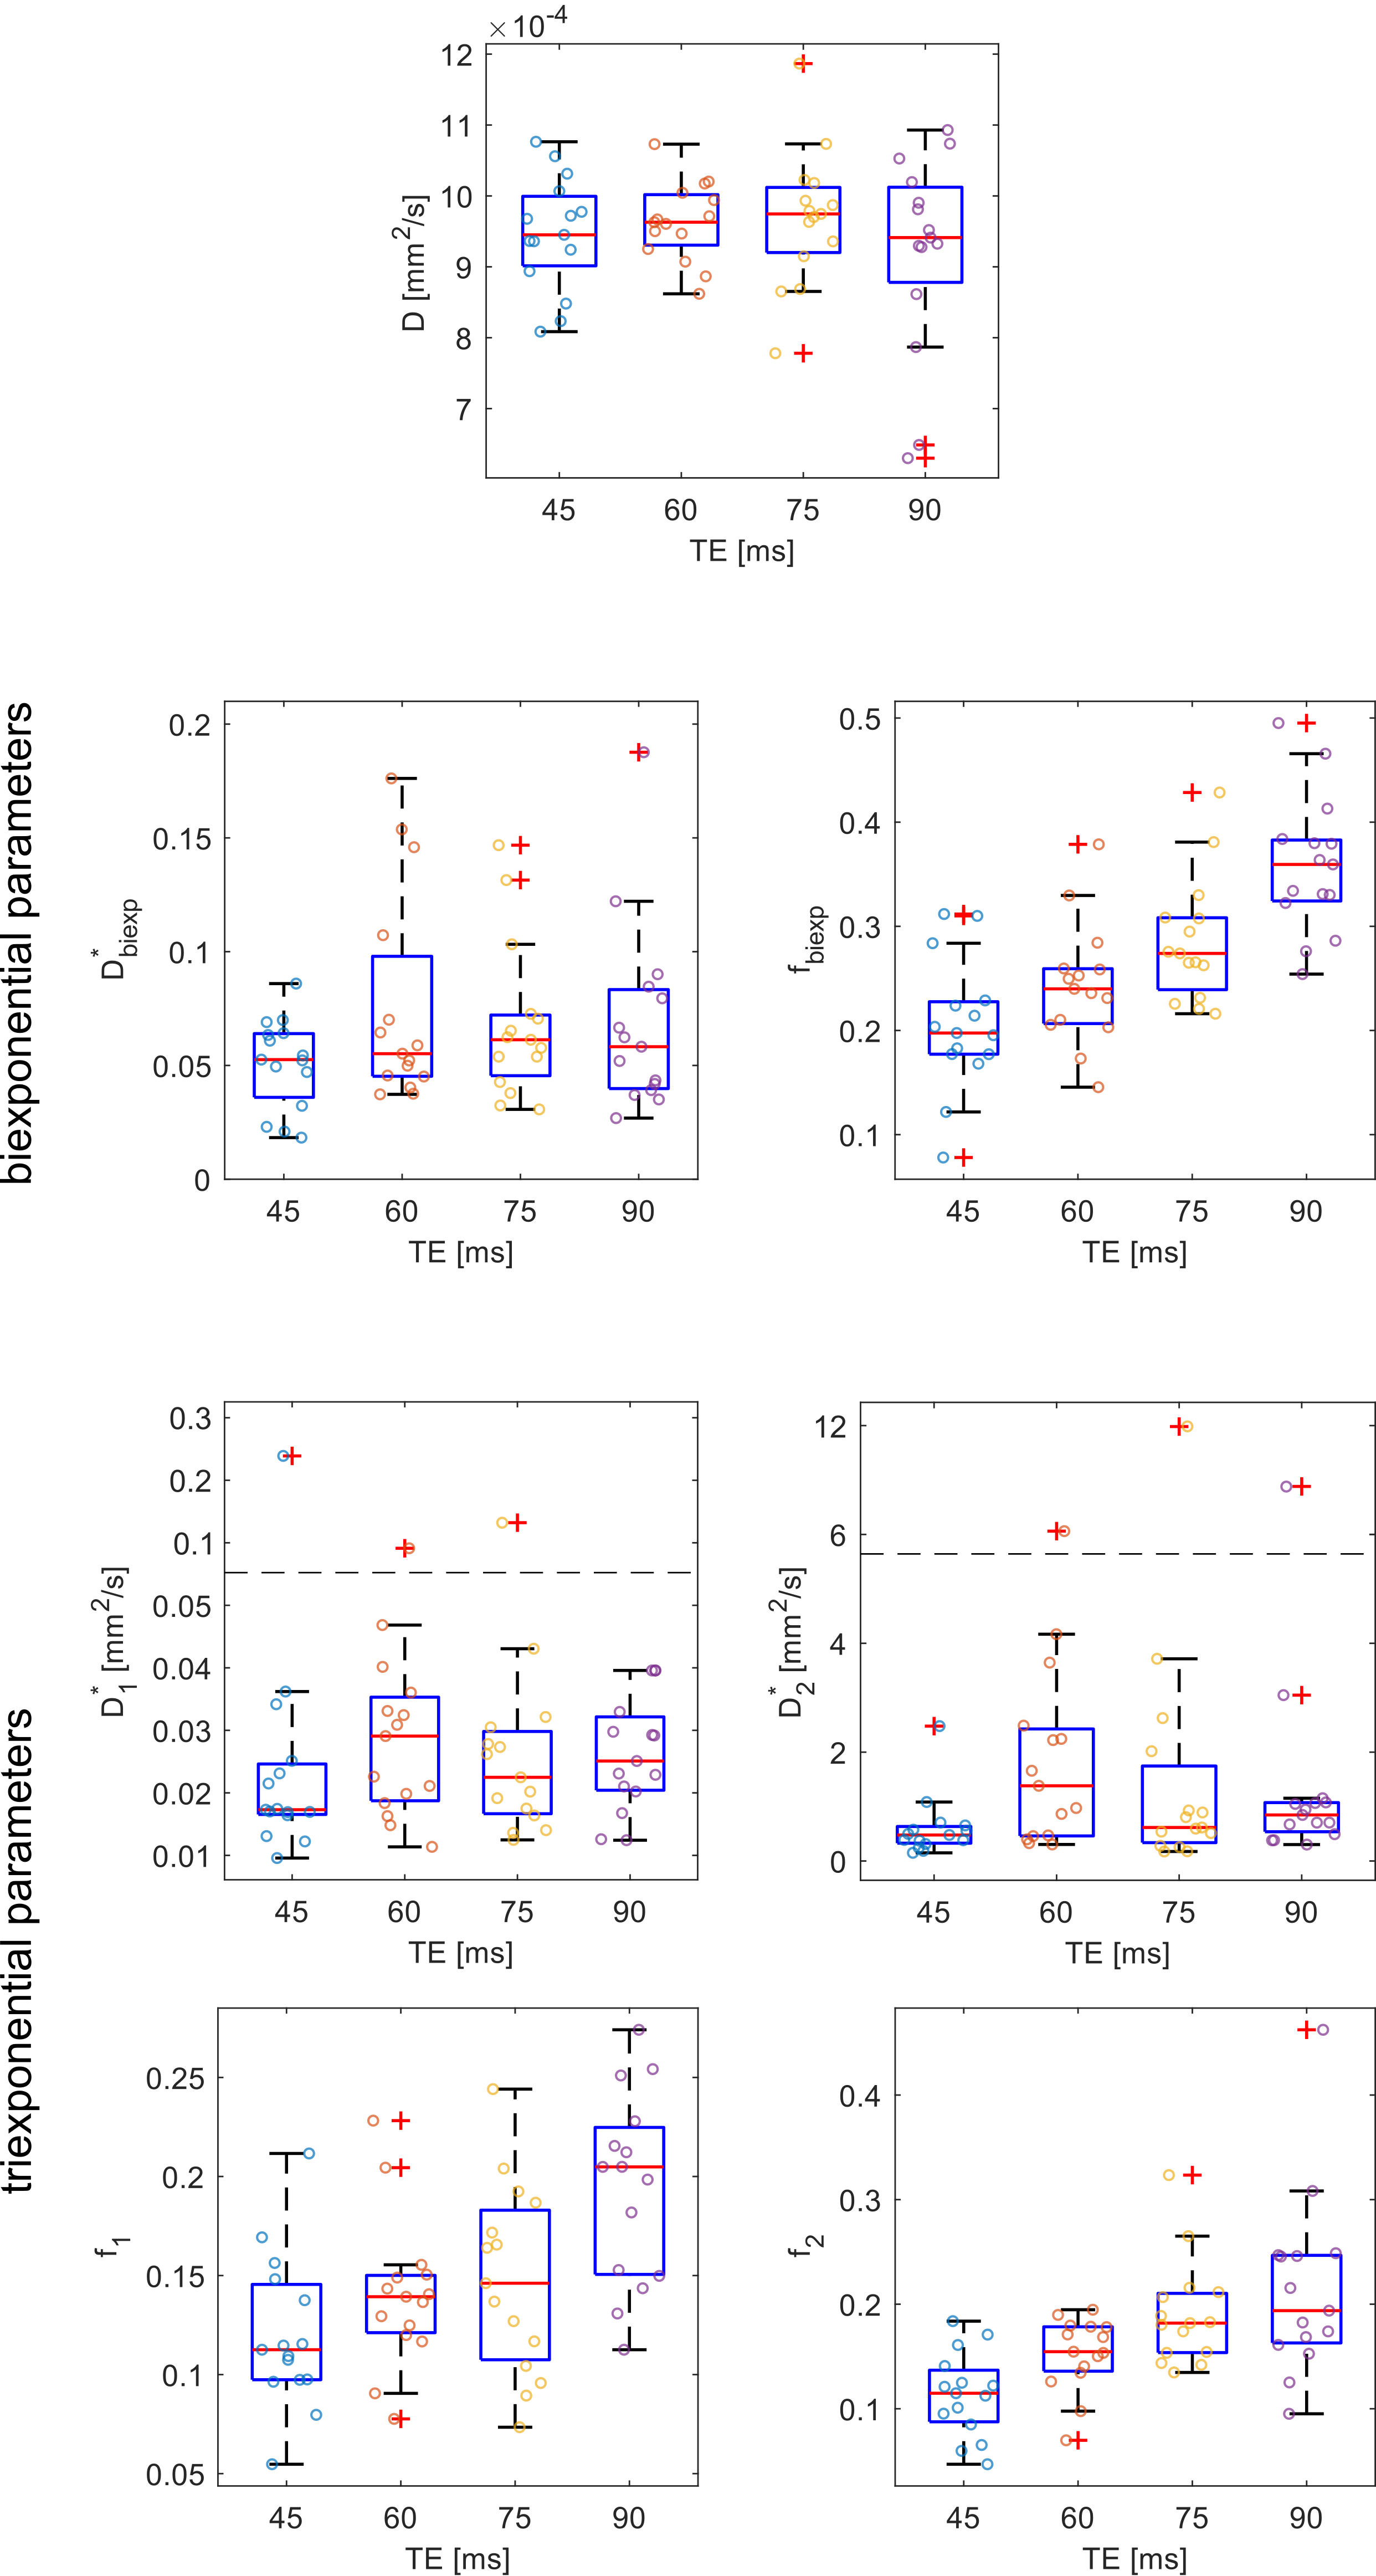
Figure 2: Box plots of the bi- and triexponential IVIM
parameters. Each point indicates the data of one volunteer. The central mark of
each box plot indicates the respective median, the bottom and top lines
indicate the 25th and 75th percentile. The whiskers reach
out to ±2.7 $$$\sigma$$$, outliers are shown as “+”. Dashed horizontal lines
show the threshold where the scale of the y-axis is changed in order to display
all points in a reasonable way.
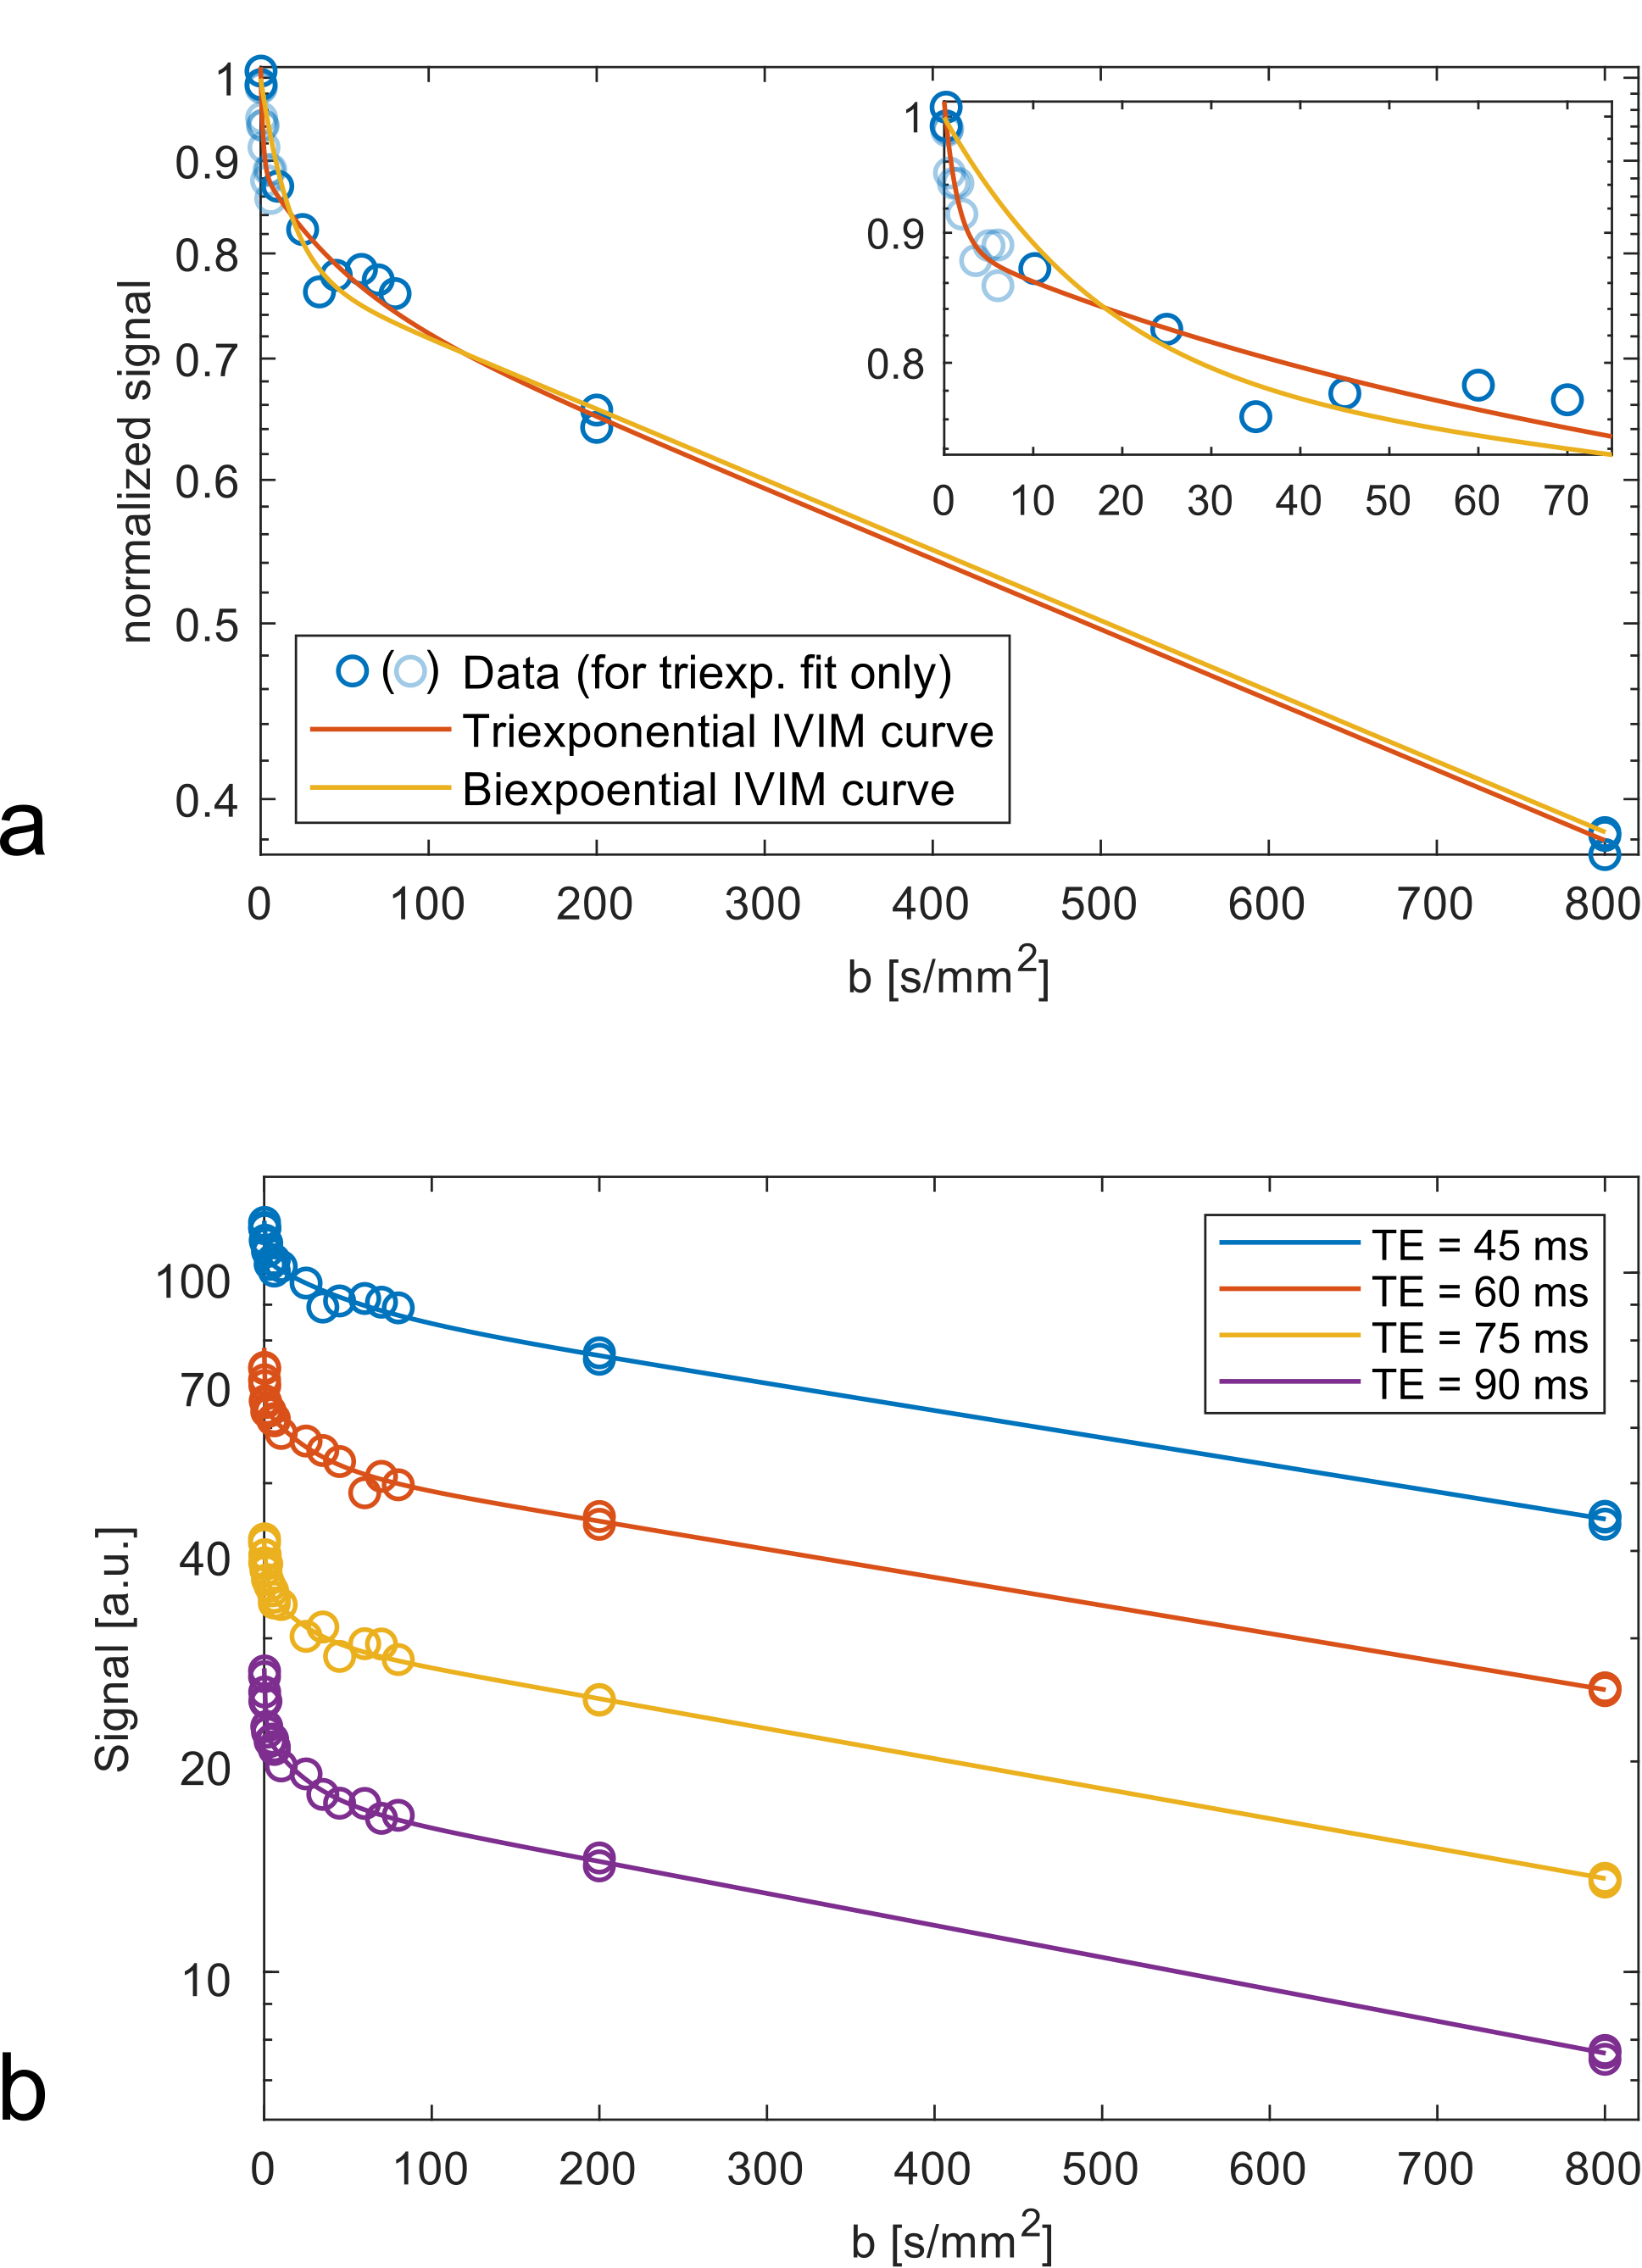
Figure 1: Signal curves. For better
readability, the displayed signal values represent the values averaged over diffusion
directions and slices . (a) Representative normalized signals of one volunteer
at TE = 45 ms. Both the biexponential and triexponential fit curves are shown.
Data points with lower brightness were used for the triexponential fit only.
(b) Representative absolute signal of one volunteer at four echo times. Lines
represent the triexponential IVIM curves.